16
16peptides
spectra
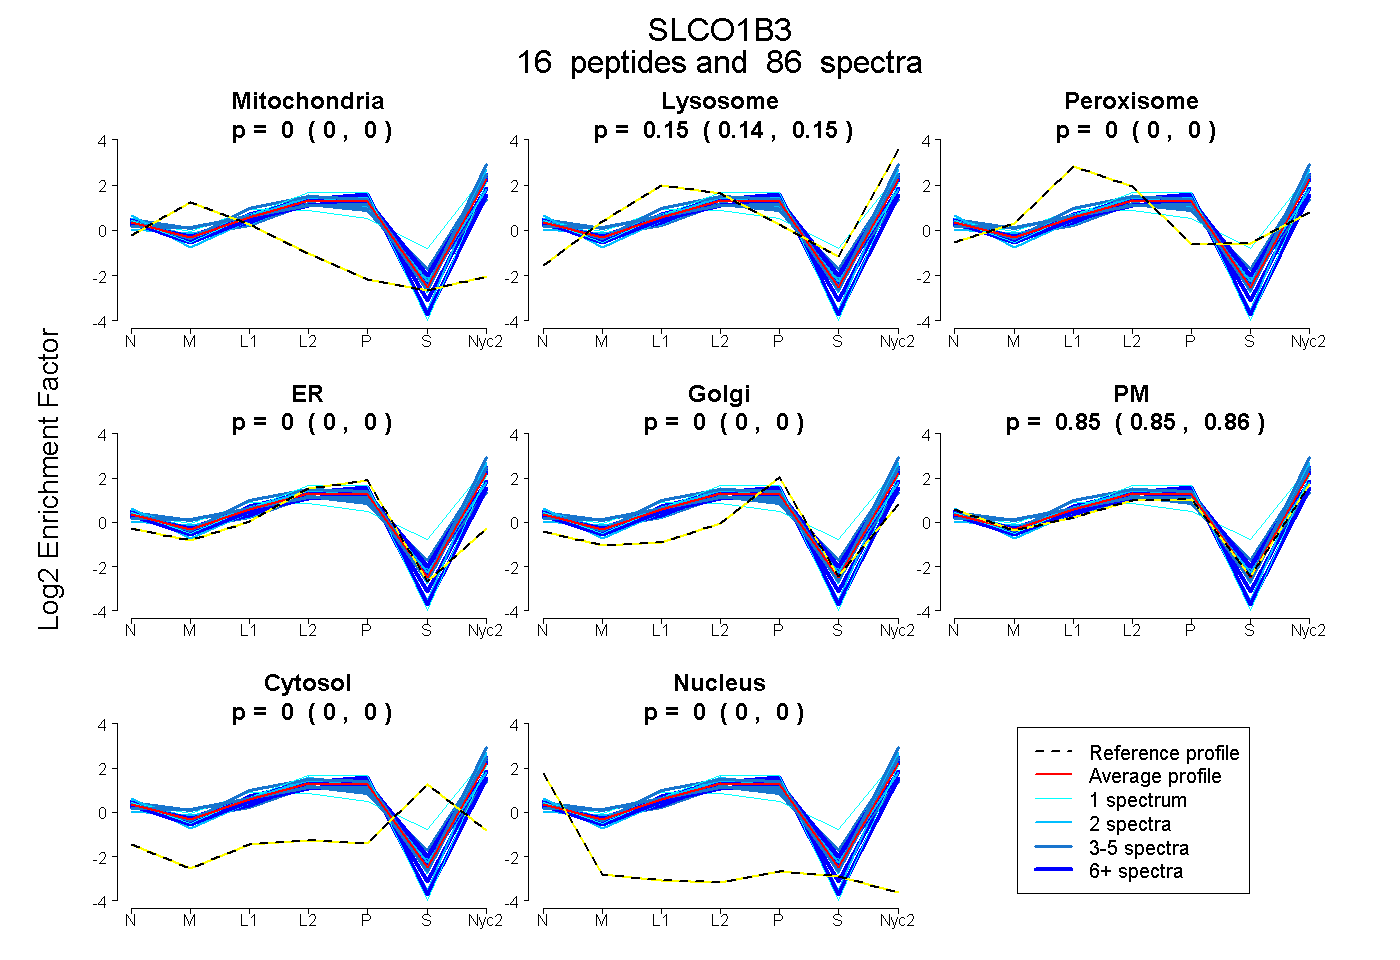
0.000 | 0.000
0.142 | 0.150
0.000 | 0.000
0.000 | 0.000
0.000 | 0.000
0.849 | 0.857
0.000 | 0.000
0.000 | 0.000
9peptides
spectra
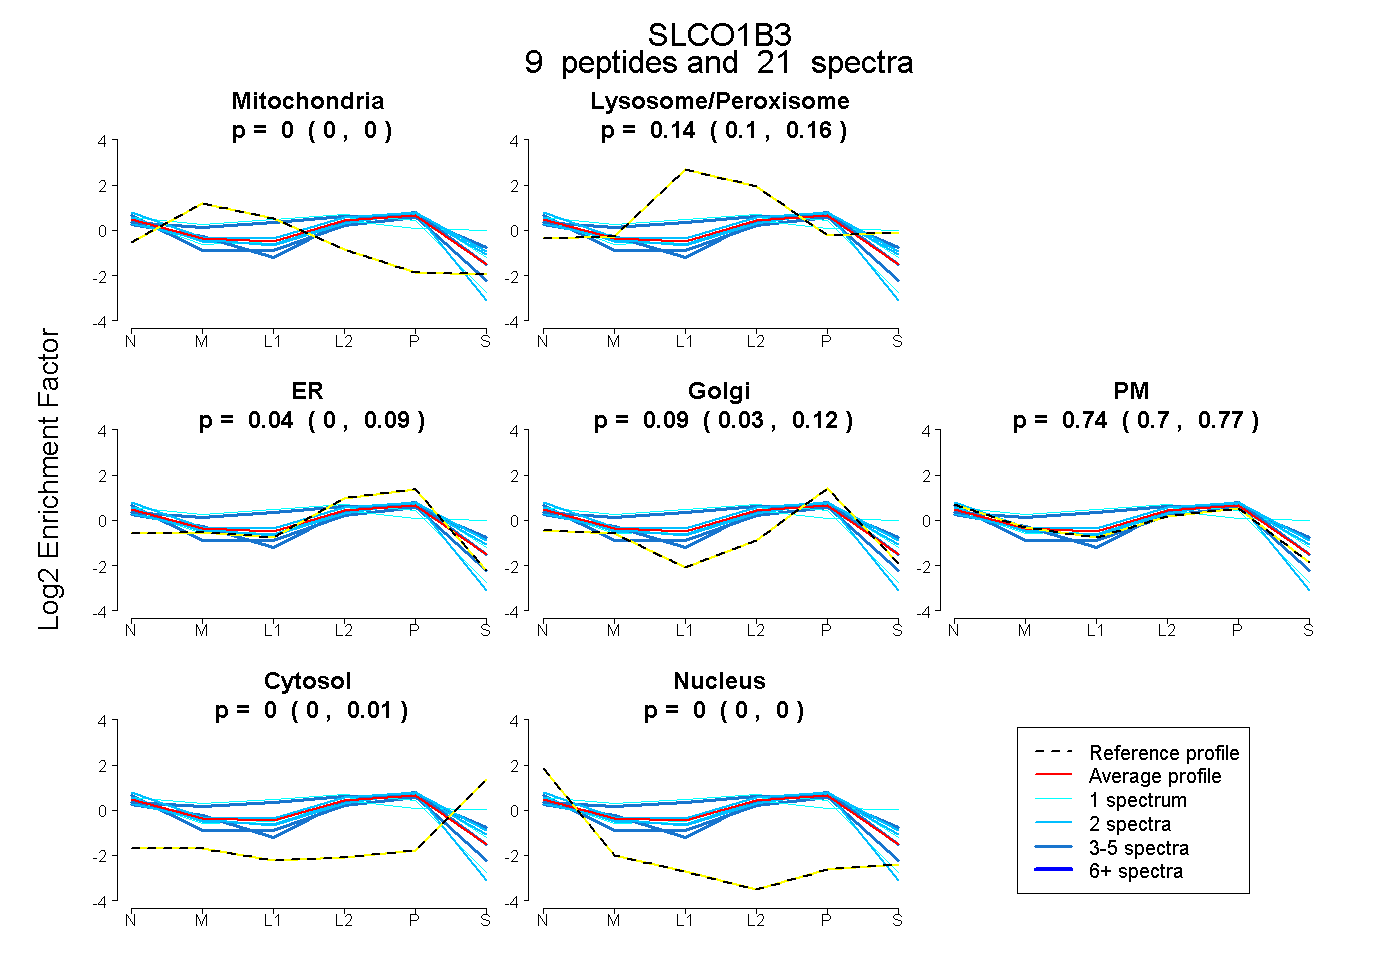
0.000 | 0.000
0.101 | 0.165
0.000 | 0.089
0.031 | 0.125
0.698 | 0.770
0.000 | 0.008
0.000 | 0.000