 18
18peptides
spectra
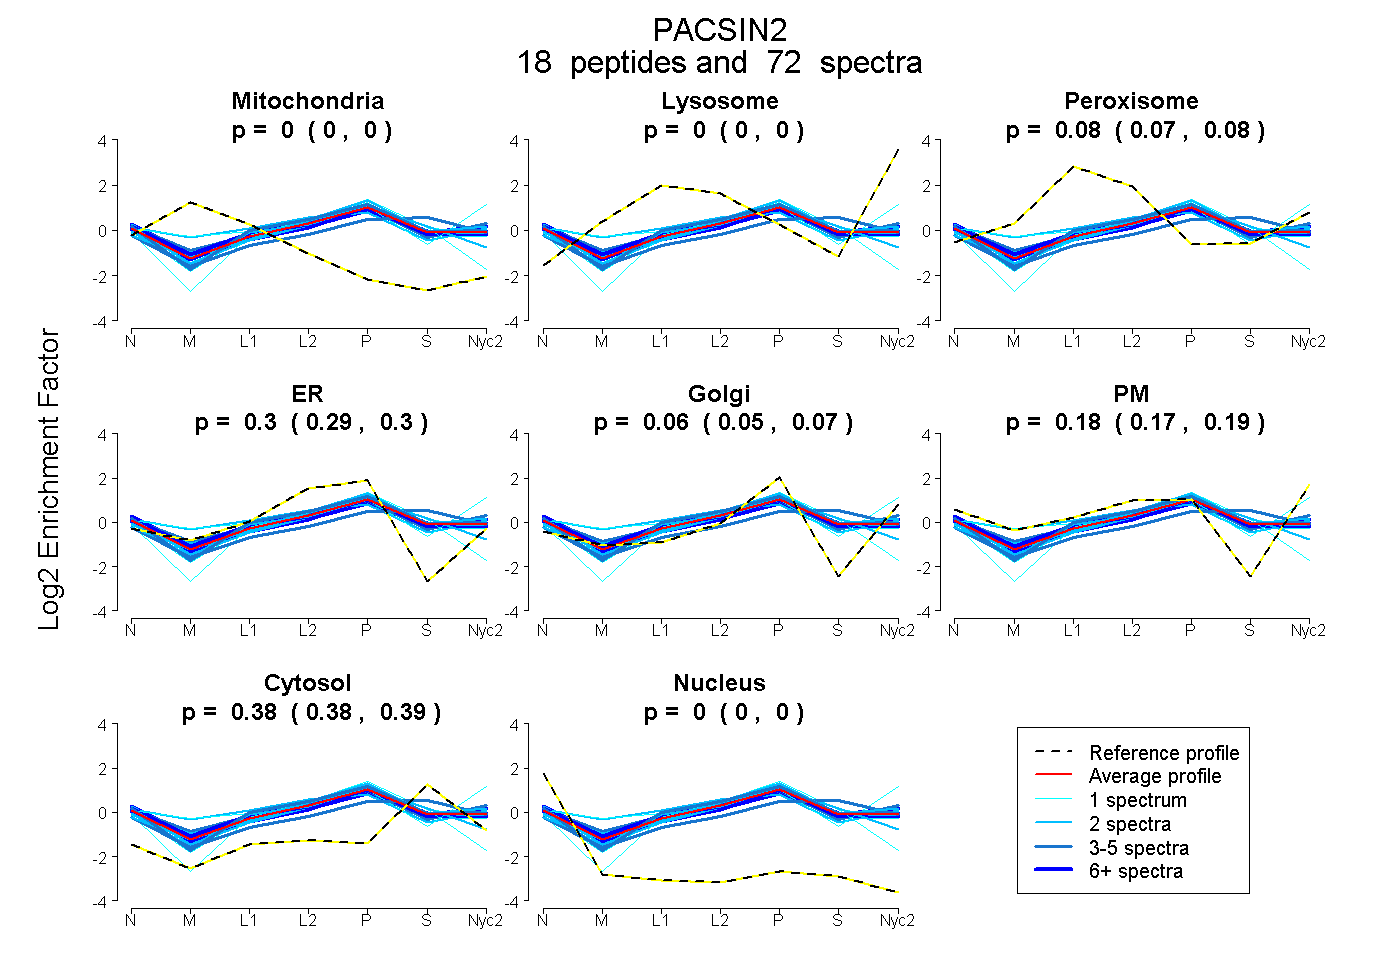
0.000 | 0.000
0.000 | 0.000
0.072 | 0.081
0.286 | 0.304
0.049 | 0.070
0.174 | 0.191
0.380 | 0.386
0.000 | 0.000
5peptides
spectra
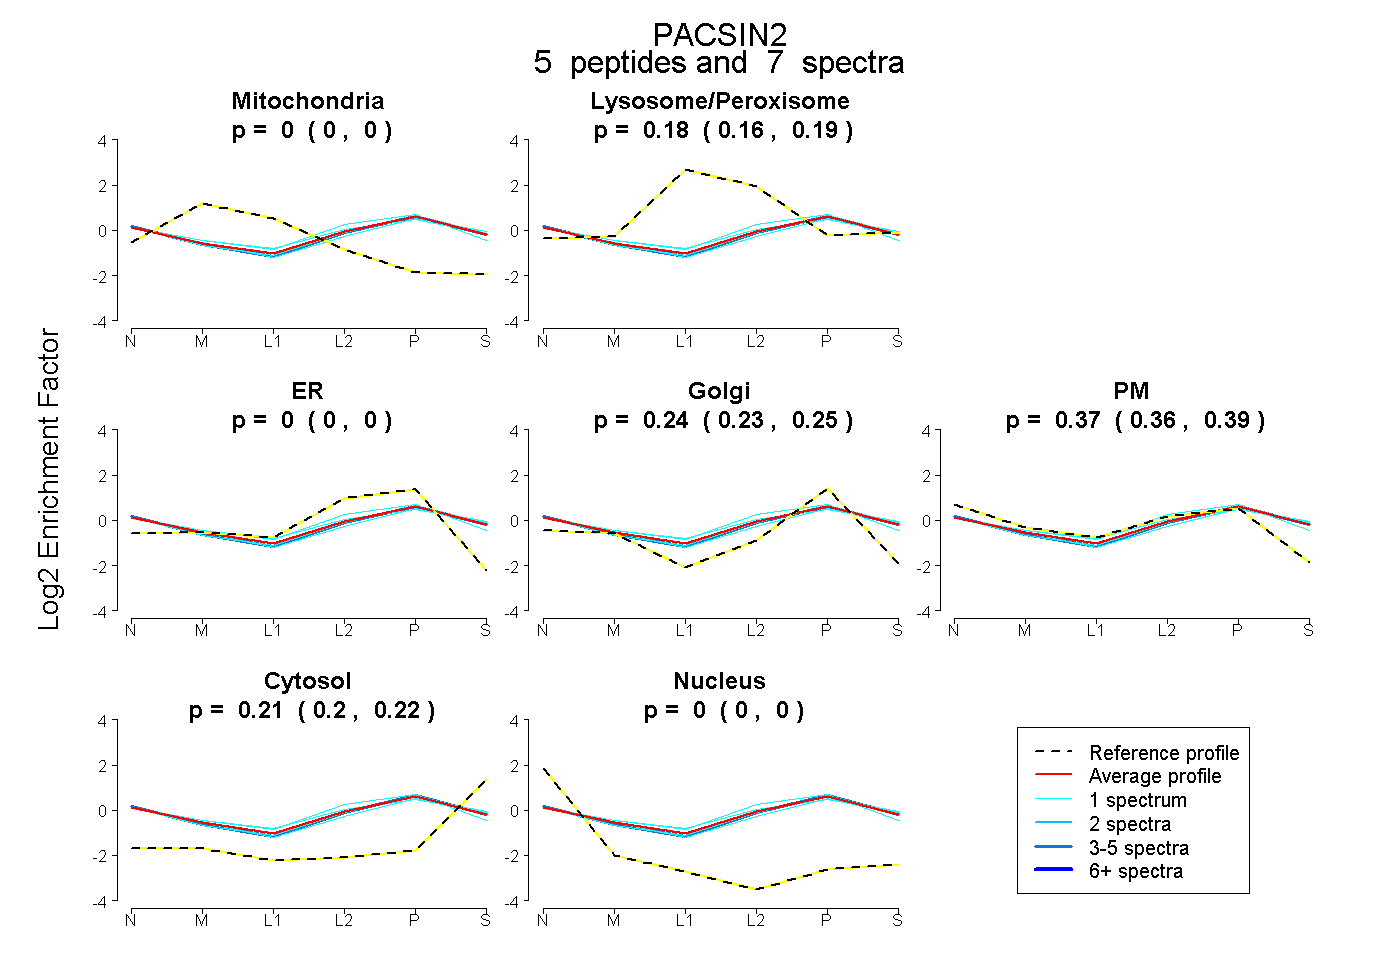
0.000 | 0.000
0.163 | 0.187
0.000 | 0.000
0.227 | 0.254
0.356 | 0.387
0.201 | 0.217
0.000 | 0.000
13peptides
spectra
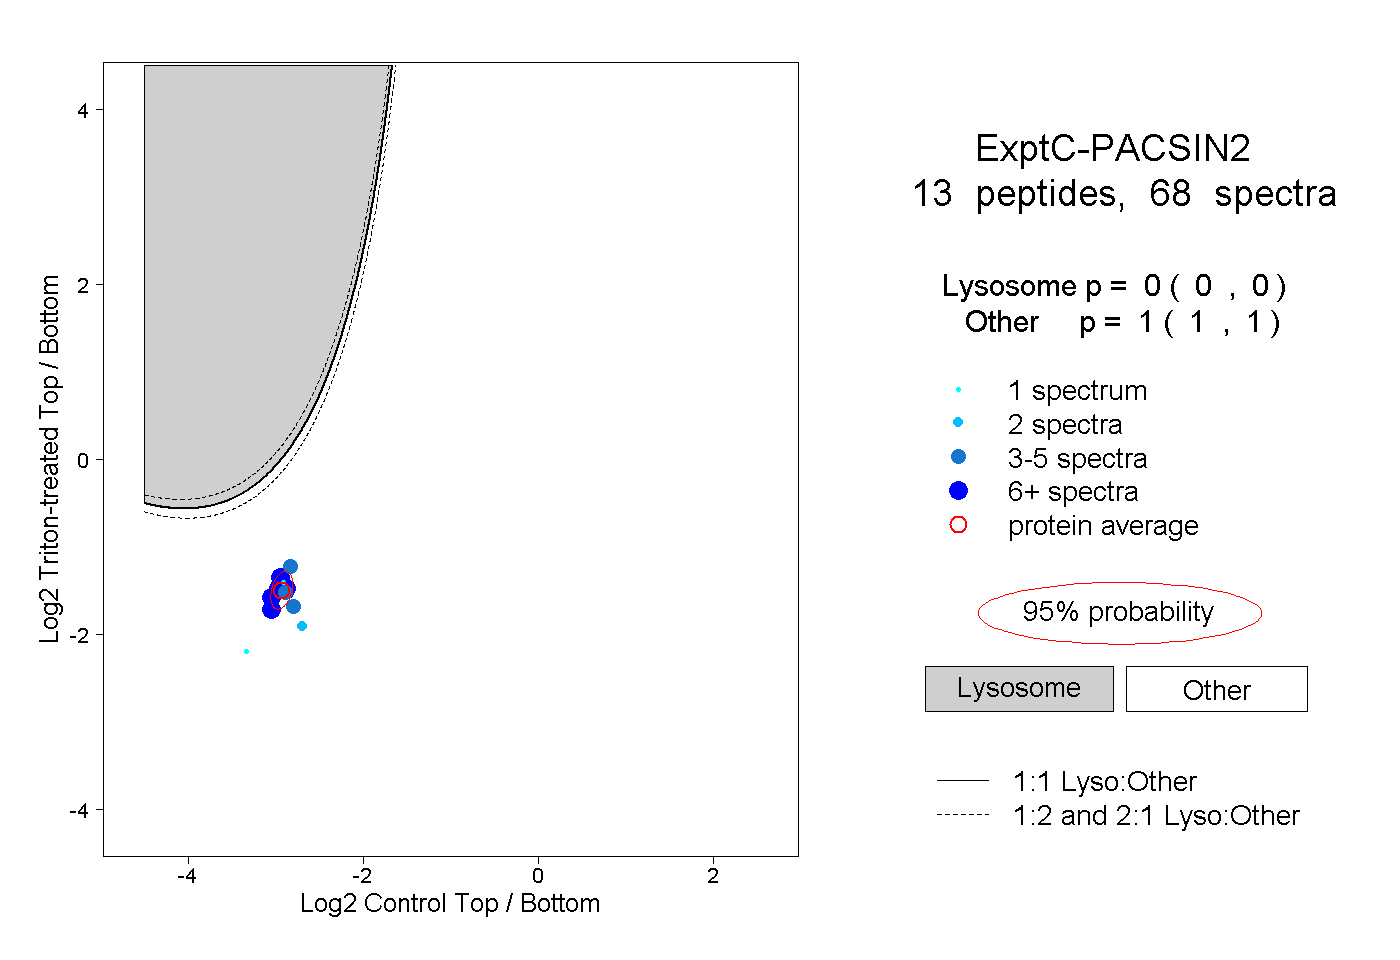
0.000 | 0.000
1.000 | 1.000
4peptides
spectra
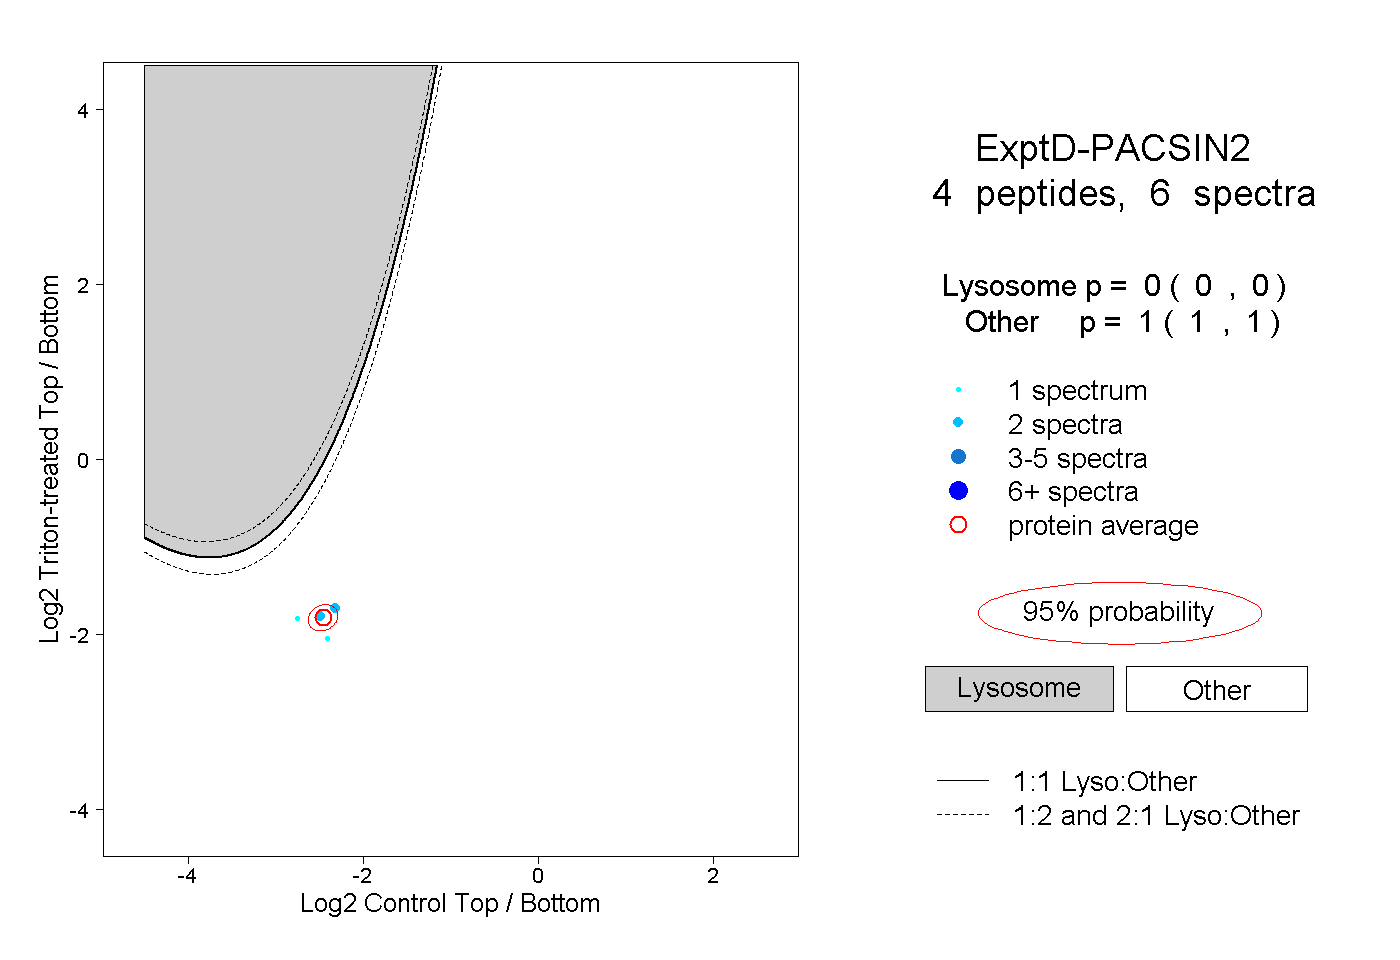
0.000 | 0.000
1.000 | 1.000