 6
6peptides
spectra
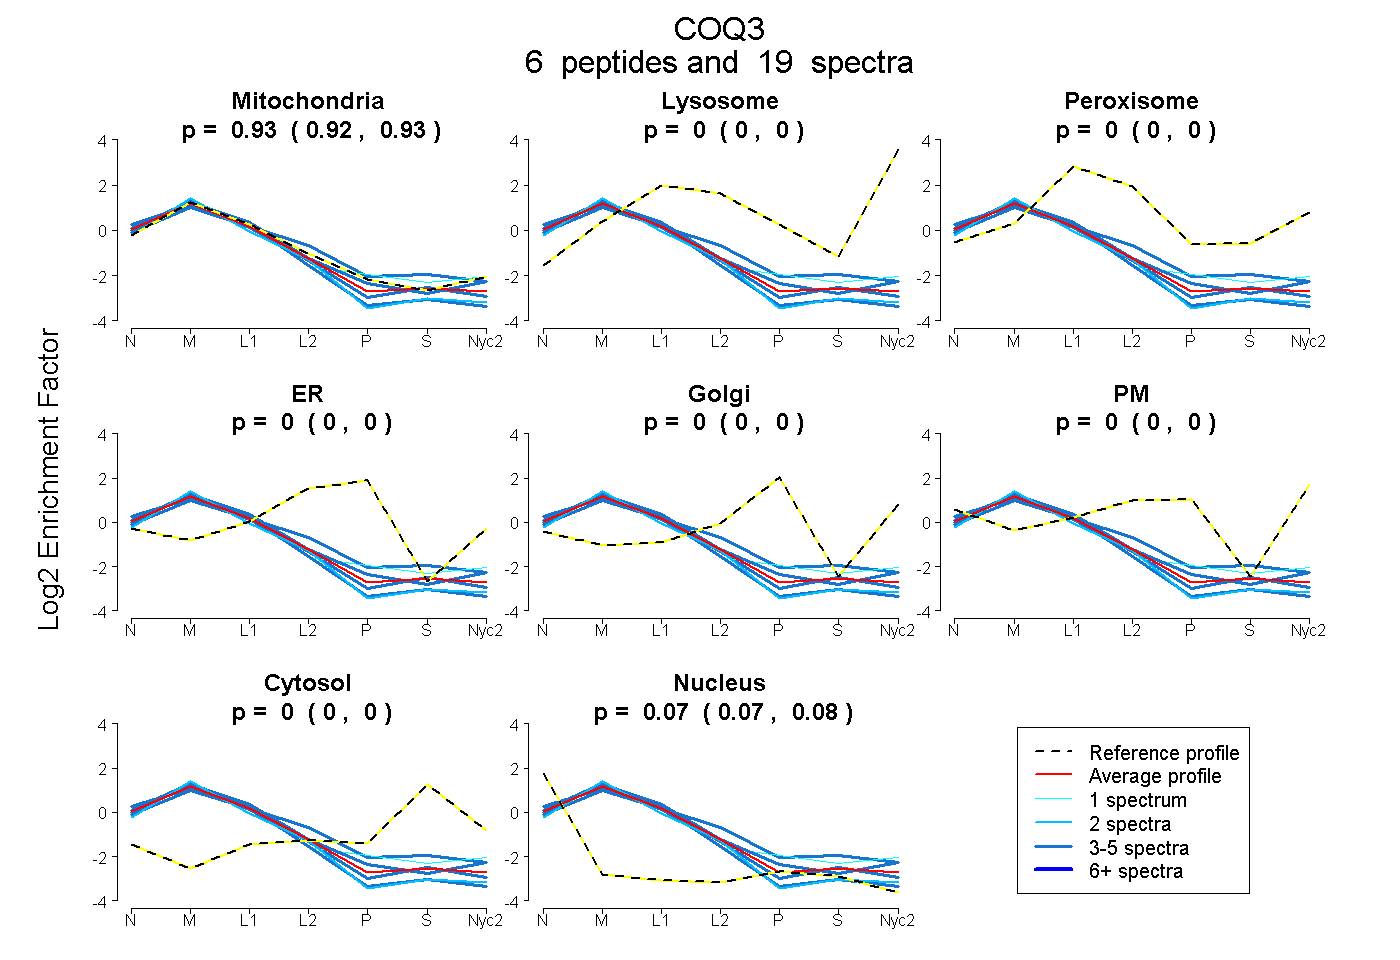
0.919 | 0.933
0.000 | 0.000
0.000 | 0.000
0.000 | 0.000
0.000 | 0.000
0.000 | 0.000
0.000 | 0.000
0.065 | 0.079
6peptides
spectra
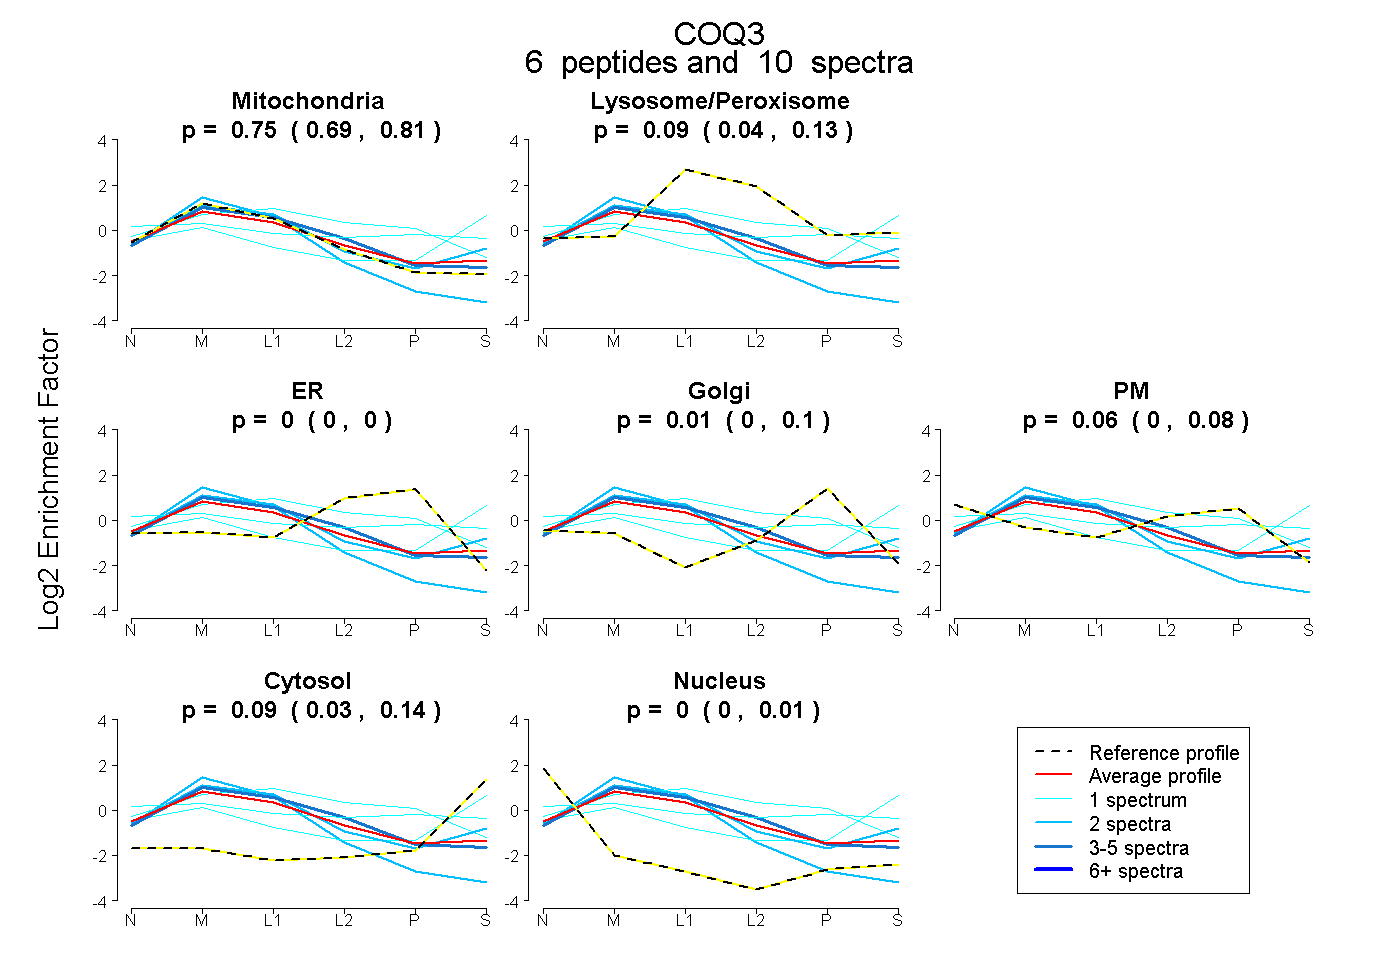
0.687 | 0.812
0.044 | 0.134
0.000 | 0.000
0.000 | 0.097
0.000 | 0.083
0.034 | 0.135
0.000 | 0.006
8peptides
spectra
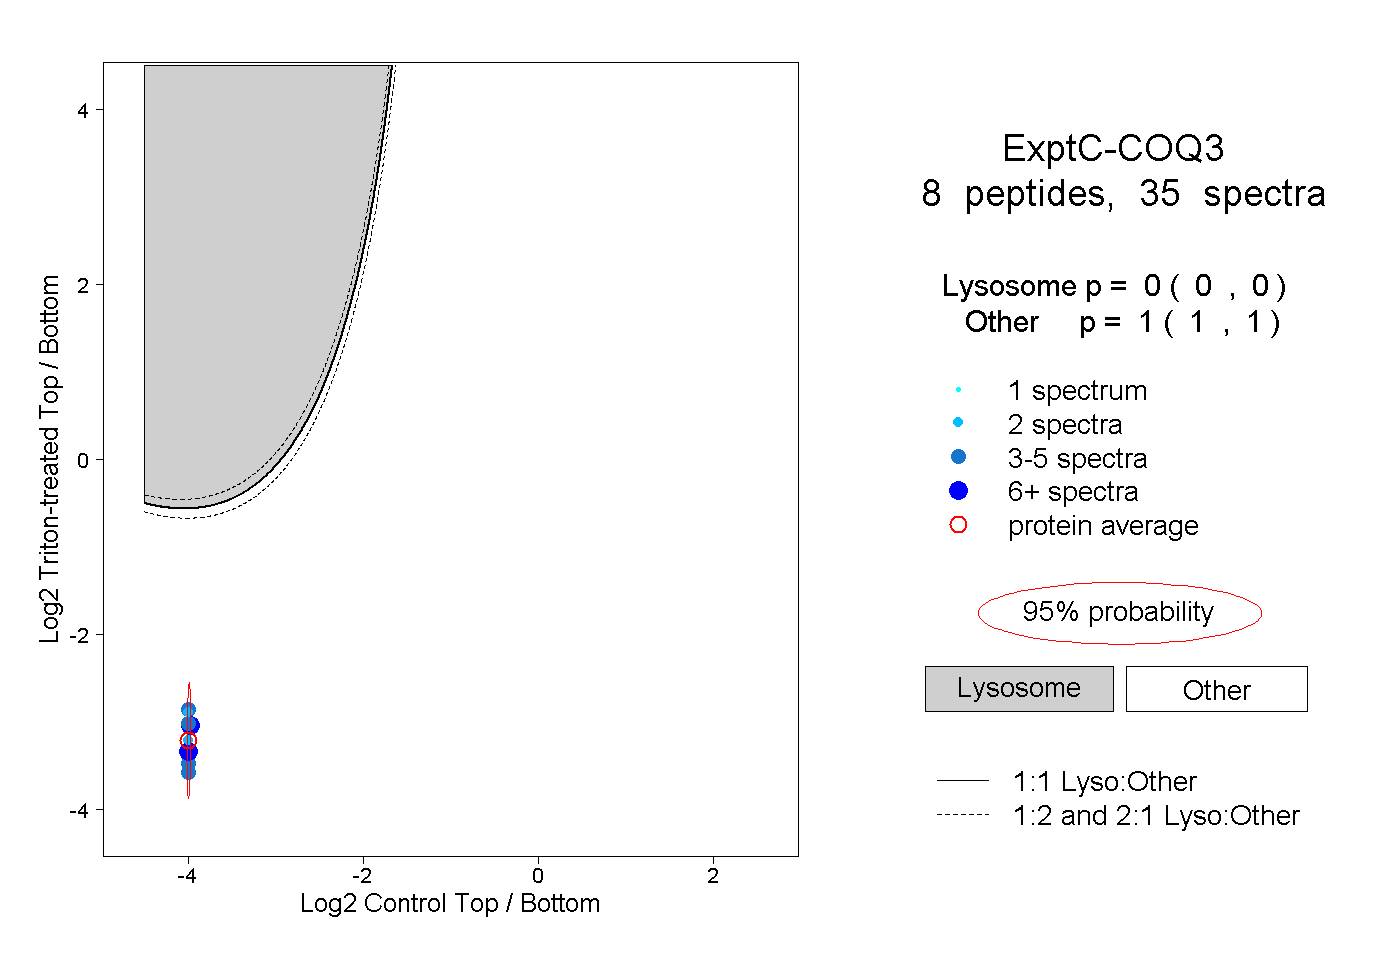
0.000 | 0.000
1.000 | 1.000
2peptides
spectra
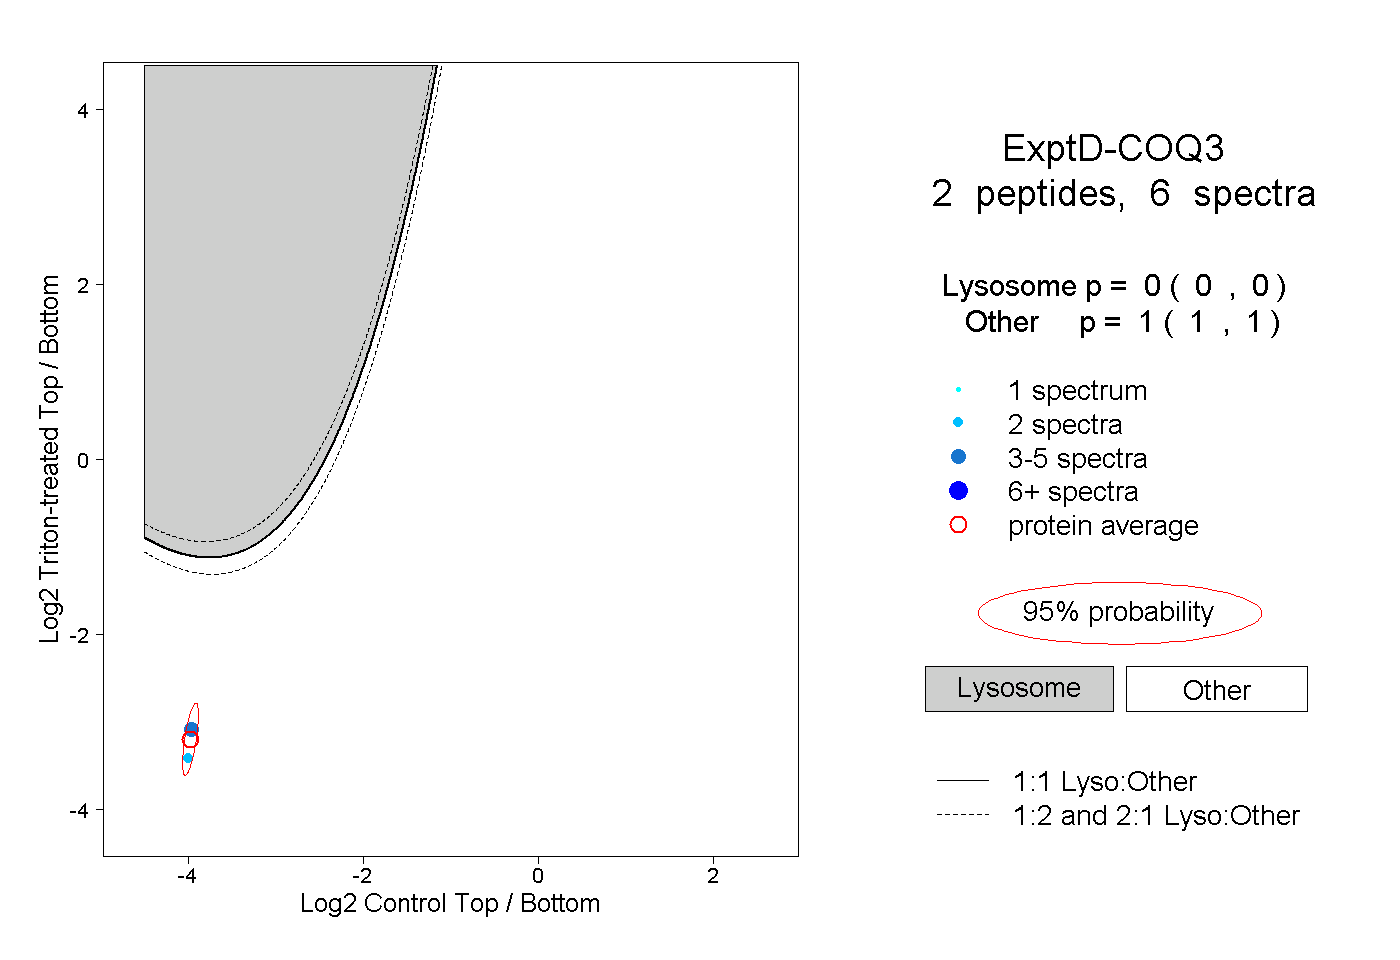
0.000 | 0.000
1.000 | 1.000