 15
15peptides
spectra
0.000 | 0.000
0.000 | 0.000
0.000 | 0.000
0.000 | 0.000
0.315 | 0.323
0.000 | 0.000
0.567 | 0.570
0.107 | 0.116
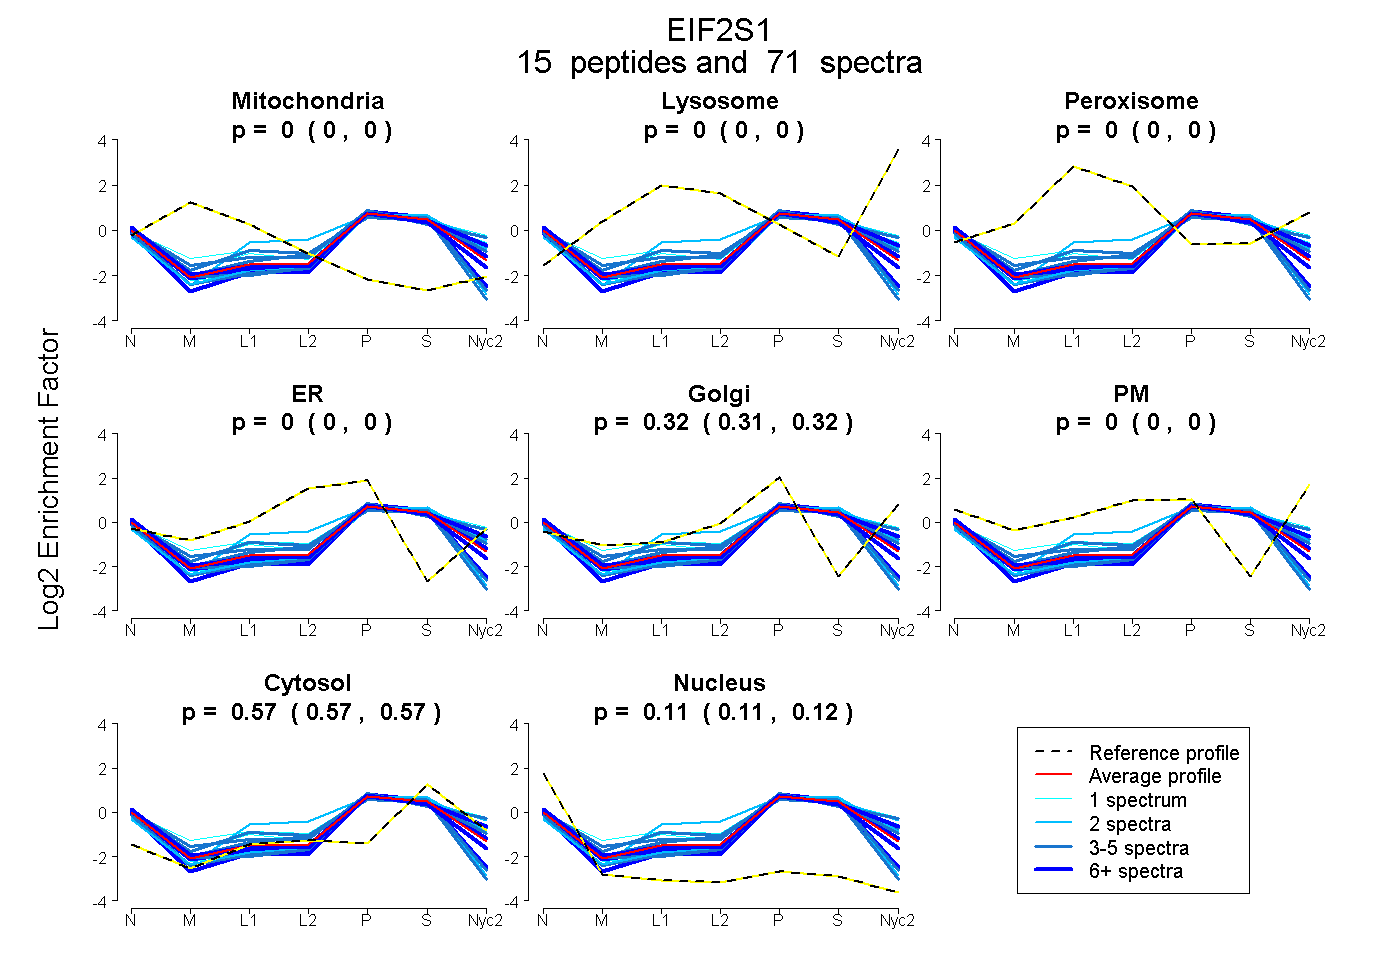
| Plot | Mito | Lyso | Perox | ER | Golgi | PM | Cytosol | Nucleus | |||||
| Expt A |
15 peptides |
71 spectra |
|
0.000 0.000 | 0.000 |
0.000 0.000 | 0.000 |
0.000 0.000 | 0.000 |
0.000 0.000 | 0.000 |
0.319 0.315 | 0.323 |
0.000 0.000 | 0.000 |
0.569 0.567 | 0.570 |
0.112 0.107 | 0.116 |
| 4 spectra, TVYSILR | 0.000 | 0.000 | 0.000 | 0.000 | 0.461 | 0.000 | 0.520 | 0.019 | ||
| 2 spectra, TAWVFDDK | 0.000 | 0.000 | 0.000 | 0.000 | 0.287 | 0.000 | 0.646 | 0.067 | ||
| 1 spectrum, GVFNVQMEPK | 0.000 | 0.000 | 0.062 | 0.000 | 0.404 | 0.000 | 0.515 | 0.019 | ||
| 3 spectra, RPGYGAYDAFK | 0.000 | 0.000 | 0.000 | 0.094 | 0.304 | 0.000 | 0.574 | 0.028 | ||
| 4 spectra, NECVVVIR | 0.000 | 0.000 | 0.000 | 0.184 | 0.000 | 0.000 | 0.549 | 0.267 | ||
| 8 spectra, YVMTTTTLER | 0.000 | 0.000 | 0.000 | 0.000 | 0.363 | 0.000 | 0.558 | 0.079 | ||
| 2 spectra, ADIEVACYGYEGIDAVK | 0.000 | 0.000 | 0.000 | 0.152 | 0.000 | 0.000 | 0.617 | 0.232 | ||
| 14 spectra, INLIAPPR | 0.000 | 0.000 | 0.000 | 0.000 | 0.323 | 0.000 | 0.551 | 0.126 | ||
| 1 spectrum, GYIDLSK | 0.000 | 0.000 | 0.000 | 0.000 | 0.425 | 0.000 | 0.575 | 0.000 | ||
| 4 spectra, LTPQAVK | 0.000 | 0.000 | 0.000 | 0.138 | 0.042 | 0.000 | 0.595 | 0.226 | ||
| 1 spectrum, EVLINNINR | 0.000 | 0.000 | 0.000 | 0.000 | 0.318 | 0.000 | 0.596 | 0.087 | ||
| 8 spectra, AGLNCSTETMPIK | 0.000 | 0.000 | 0.000 | 0.026 | 0.162 | 0.000 | 0.586 | 0.226 | ||
| 3 spectra, VSPEEAIK | 0.000 | 0.000 | 0.000 | 0.047 | 0.305 | 0.000 | 0.568 | 0.080 | ||
| 14 spectra, VVTDTDETELAR | 0.000 | 0.000 | 0.000 | 0.010 | 0.305 | 0.000 | 0.525 | 0.160 | ||
| 2 spectra, HVAEVLEYTK | 0.000 | 0.000 | 0.000 | 0.205 | 0.102 | 0.099 | 0.593 | 0.000 |
| Plot | Mito | Lyso or Perox | ER | Golgi | PM | Cytosol | Nucleus | ||||||
| Expt B |
8 peptides |
20 spectra |
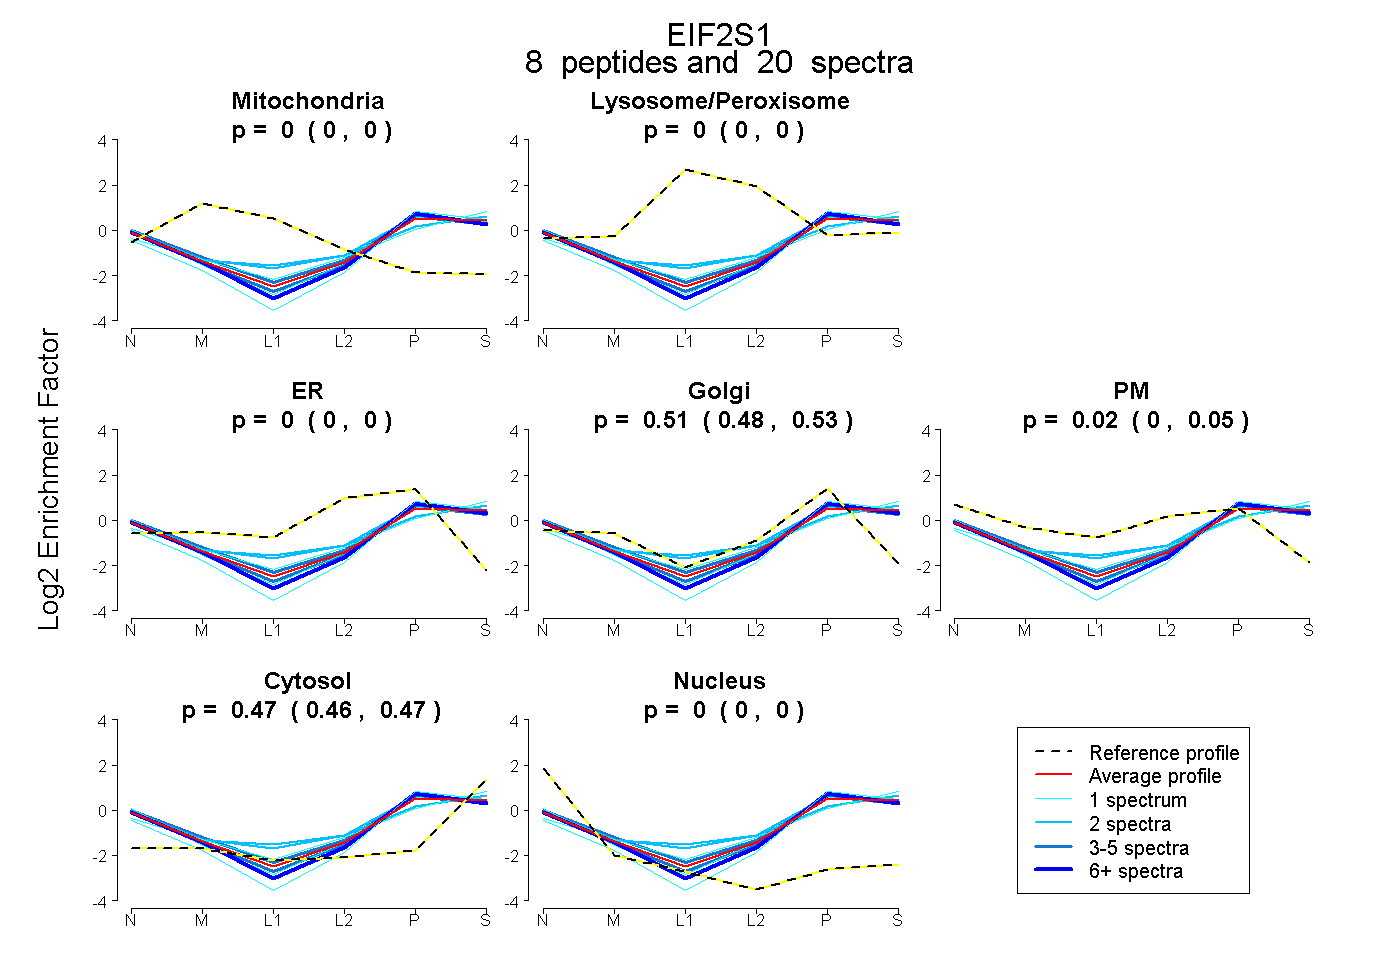 |
0.000 0.000 | 0.000 |
0.000 0.000 | 0.000 |
0.000 0.000 | 0.000 |
0.511 0.478 | 0.534 |
0.023 0.000 | 0.050 |
0.466 0.458 | 0.472 |
0.000 0.000 | 0.000 |
|||
| Plot | Lyso | Other | |||||||||||
| Expt C |
14 peptides |
47 spectra |
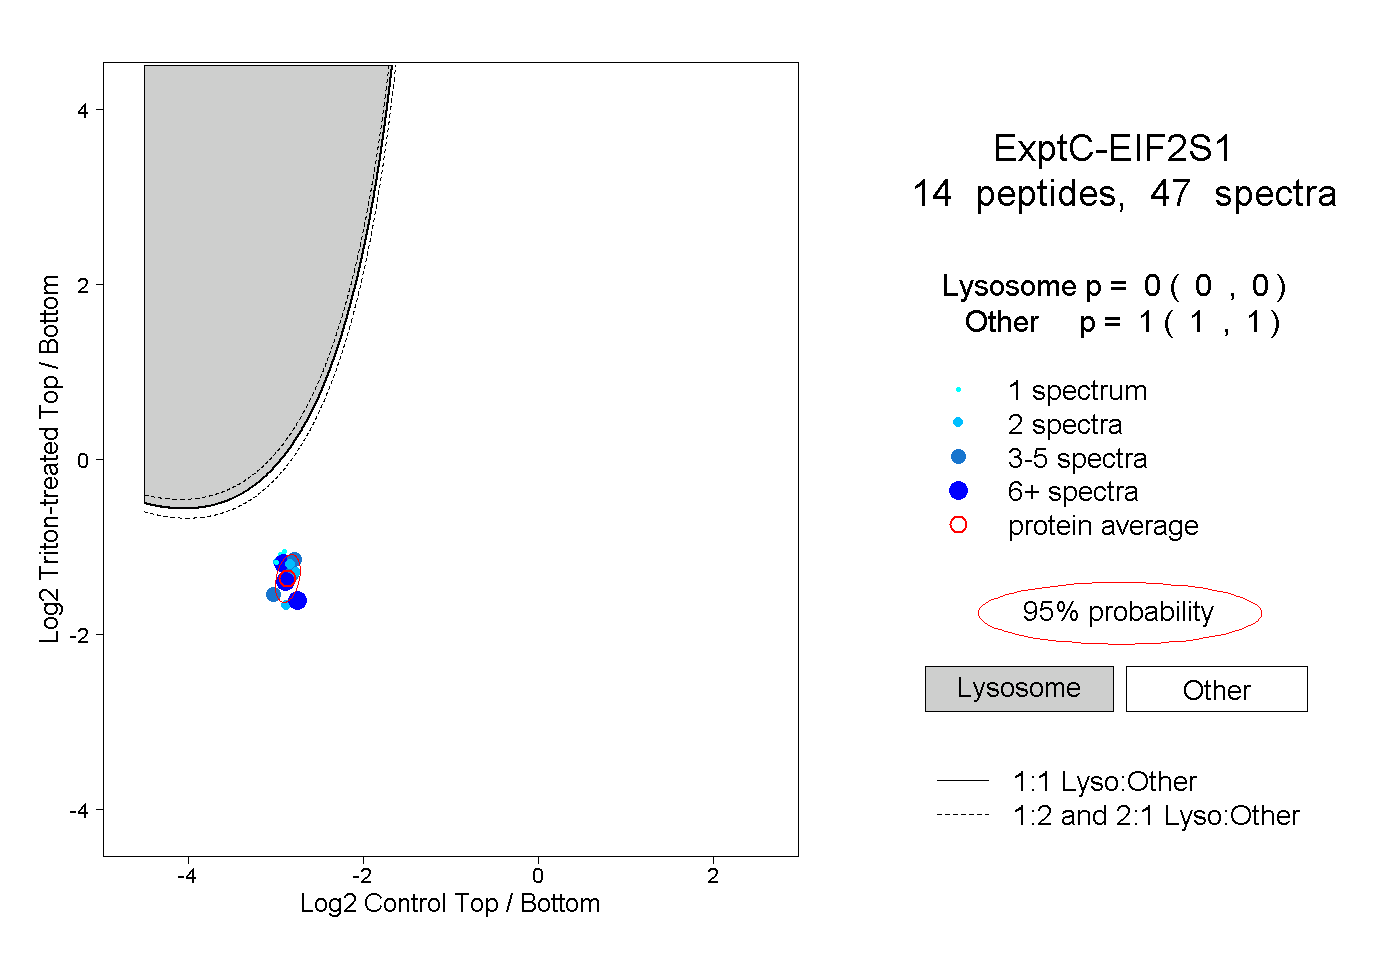 |
0.000 0.000 | 0.000 |
1.000 1.000 | 1.000 |
||||||||
| Plot | Lyso | Other | |||||||||||
| Expt D |
2 peptides |
11 spectra |
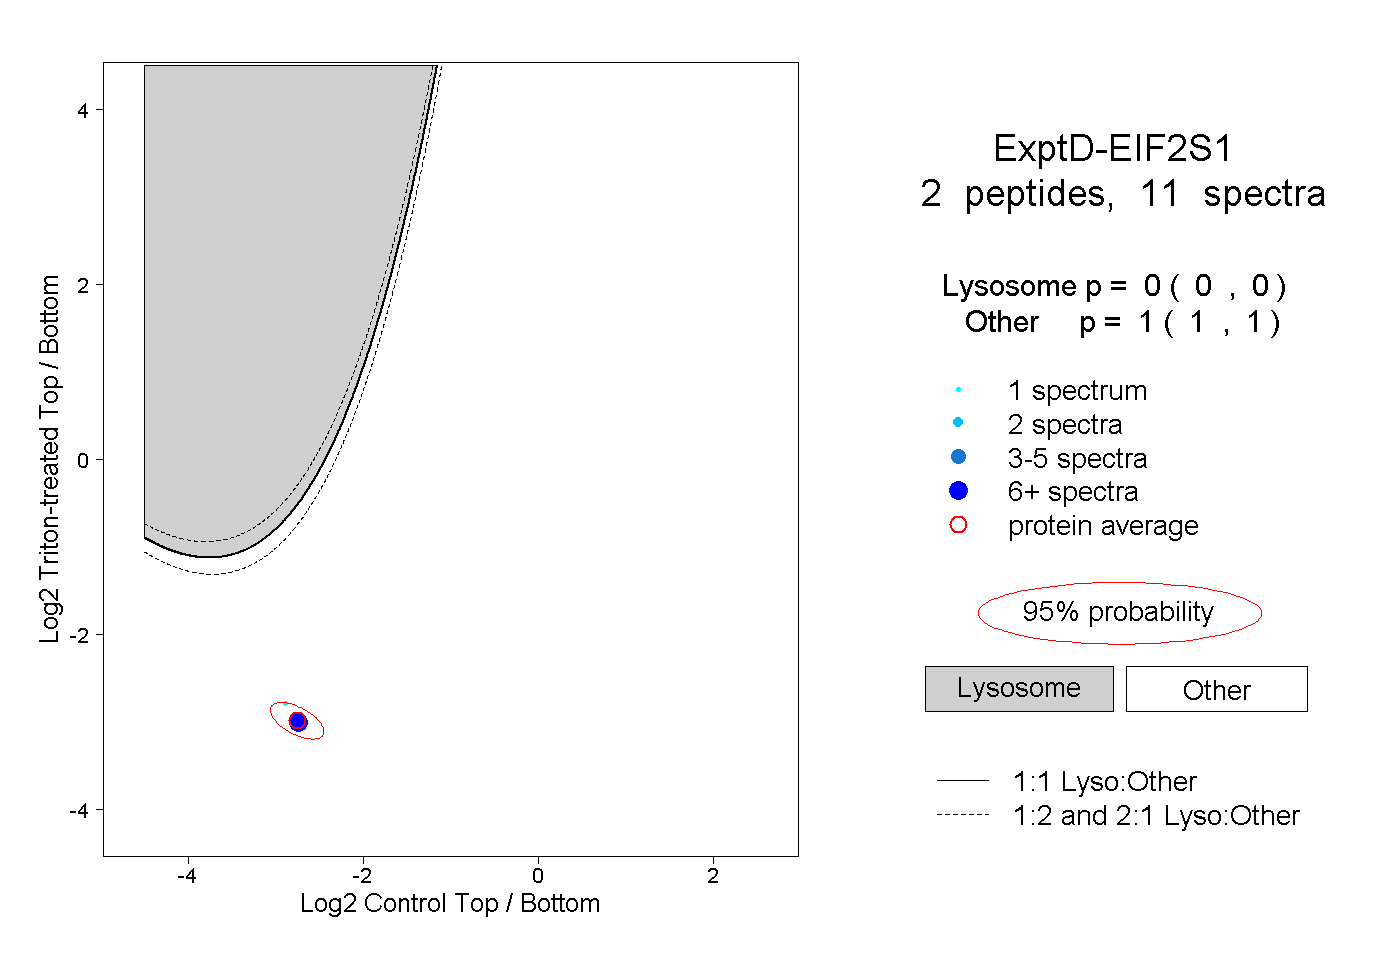 |
0.000 0.000 | 0.000 |
1.000 1.000 | 1.000 |