 4
4peptides
spectra
0.000 | 0.000
0.012 | 0.121
0.000 | 0.099
0.000 | 0.000
0.000 | 0.000
0.164 | 0.227
0.662 | 0.708
0.000 | 0.000
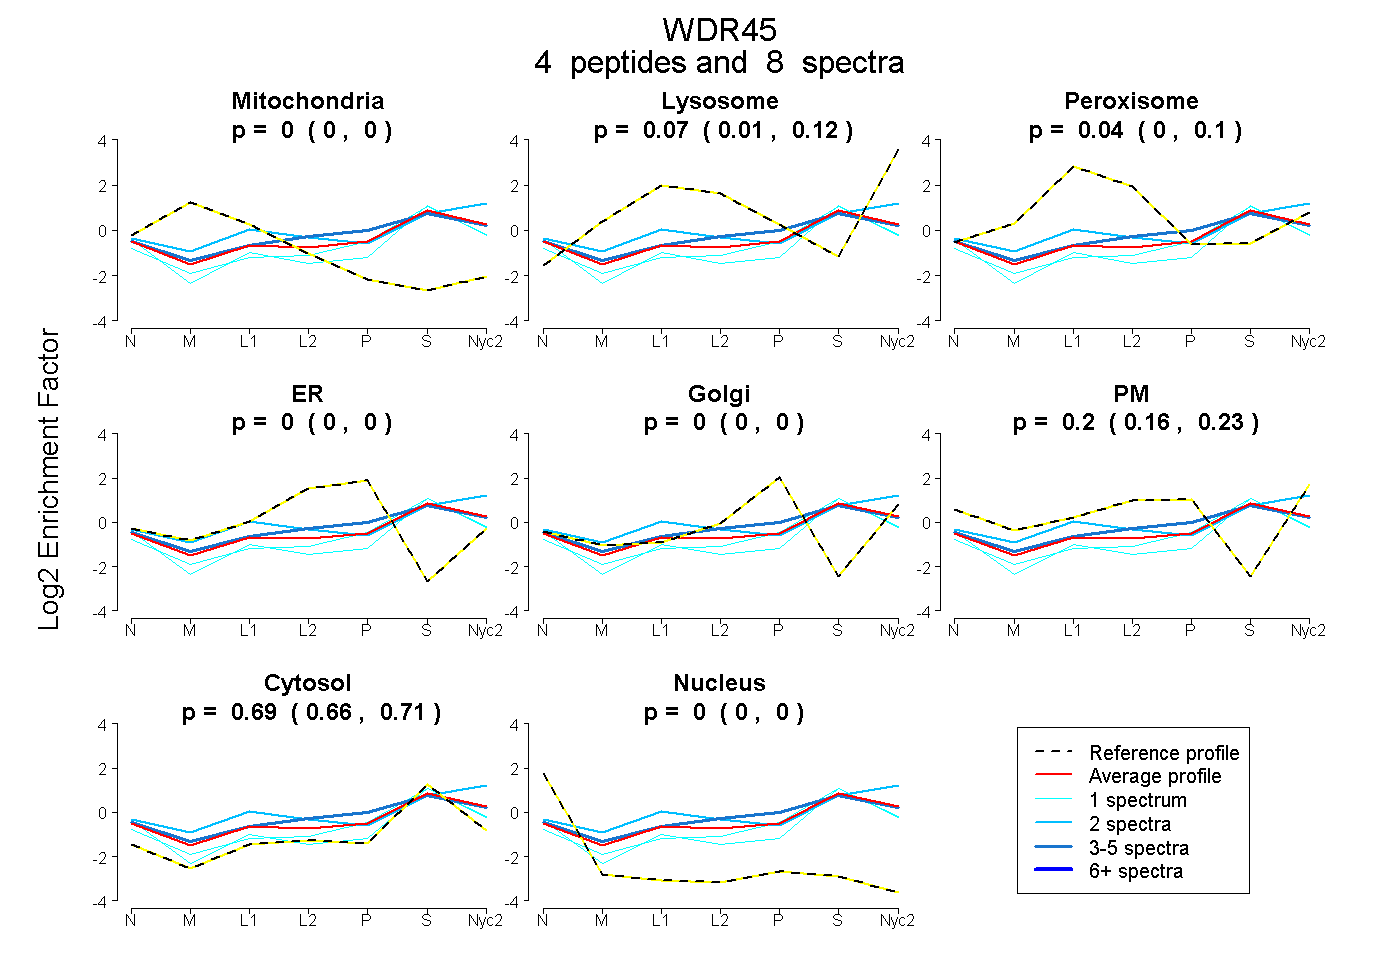
| Plot | Mito | Lyso | Perox | ER | Golgi | PM | Cytosol | Nucleus | |||||
| Expt A |
4 peptides |
8 spectra |
|
0.000 0.000 | 0.000 |
0.073 0.012 | 0.121 |
0.040 0.000 | 0.099 |
0.000 0.000 | 0.000 |
0.000 0.000 | 0.000 |
0.200 0.164 | 0.227 |
0.687 0.662 | 0.708 |
0.000 0.000 | 0.000 |
| 1 spectrum, GTVHIFALK | 0.000 | 0.000 | 0.010 | 0.000 | 0.000 | 0.117 | 0.844 | 0.028 | ||
| 2 spectra, IYNVEPLMEK | 0.000 | 0.281 | 0.076 | 0.000 | 0.000 | 0.110 | 0.534 | 0.000 | ||
| 1 spectrum, LFEFDTR | 0.000 | 0.017 | 0.000 | 0.000 | 0.067 | 0.117 | 0.799 | 0.000 | ||
| 4 spectra, QLLVFPGHK | 0.000 | 0.039 | 0.083 | 0.000 | 0.033 | 0.238 | 0.608 | 0.000 |
| Plot | Lyso | Other | |||||||||||
| Expt C |
2 peptides |
2 spectra |
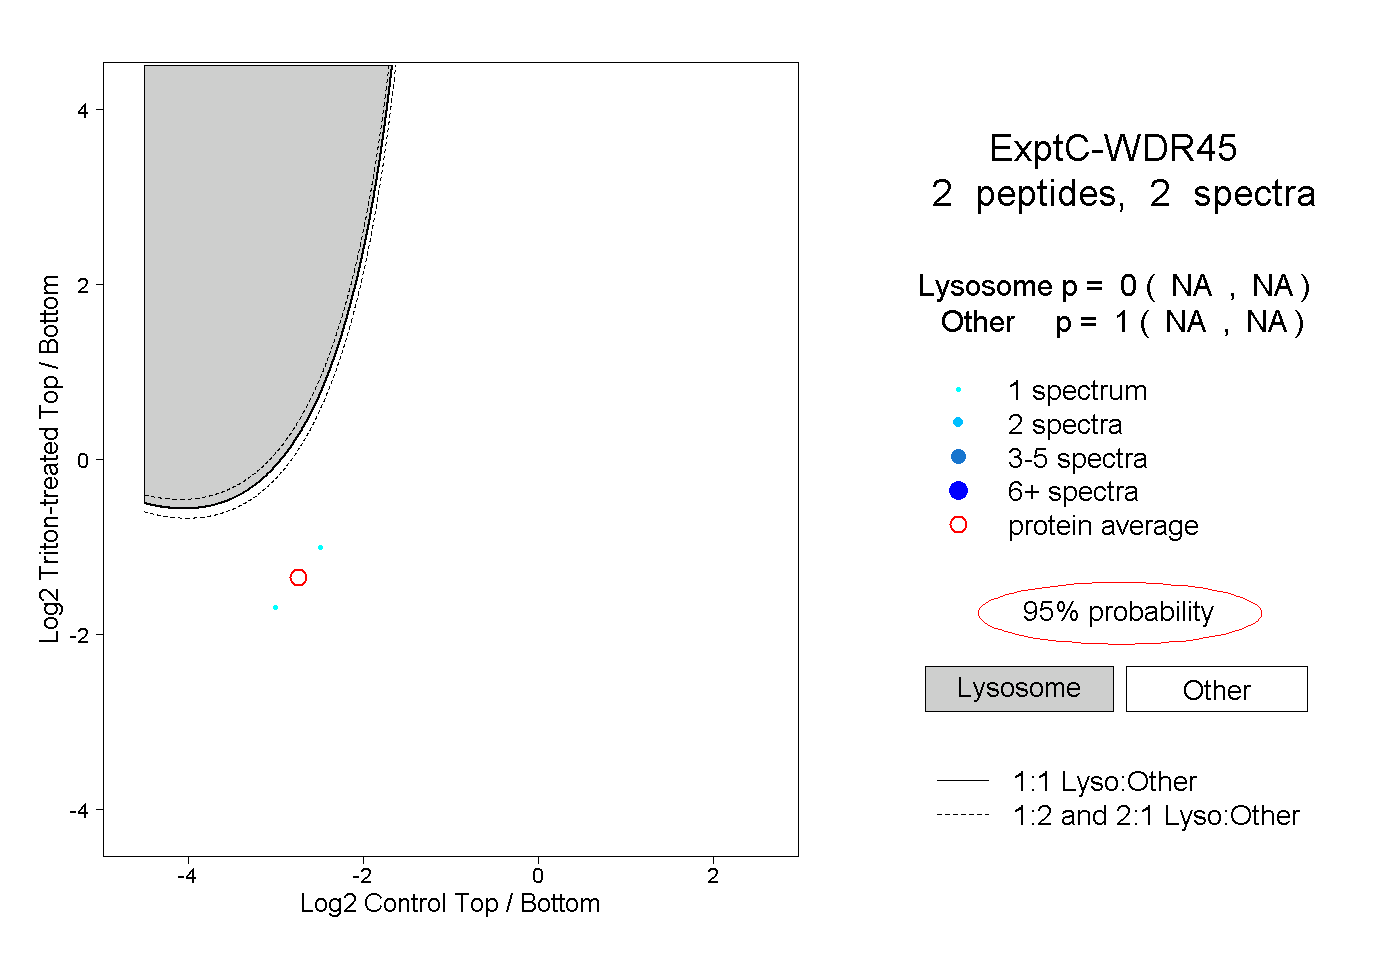 |
0.000 NA | NA |
1.000 NA | NA |