 18
18peptides
spectra
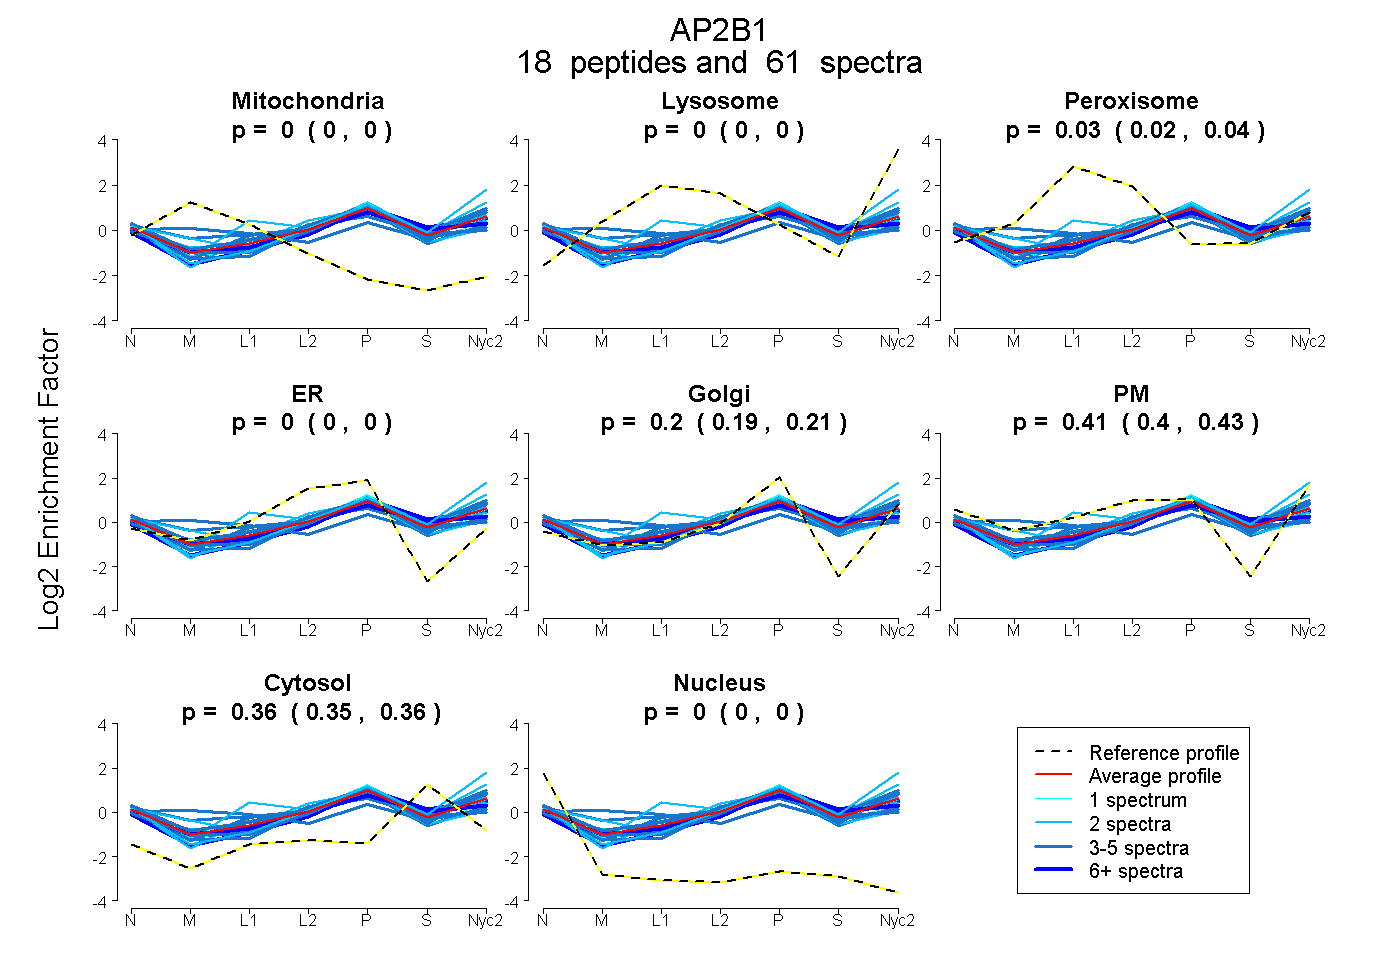
0.000 | 0.000
0.000 | 0.000
0.023 | 0.036
0.000 | 0.000
0.188 | 0.207
0.401 | 0.426
0.353 | 0.361
0.000 | 0.000
19peptides
spectra
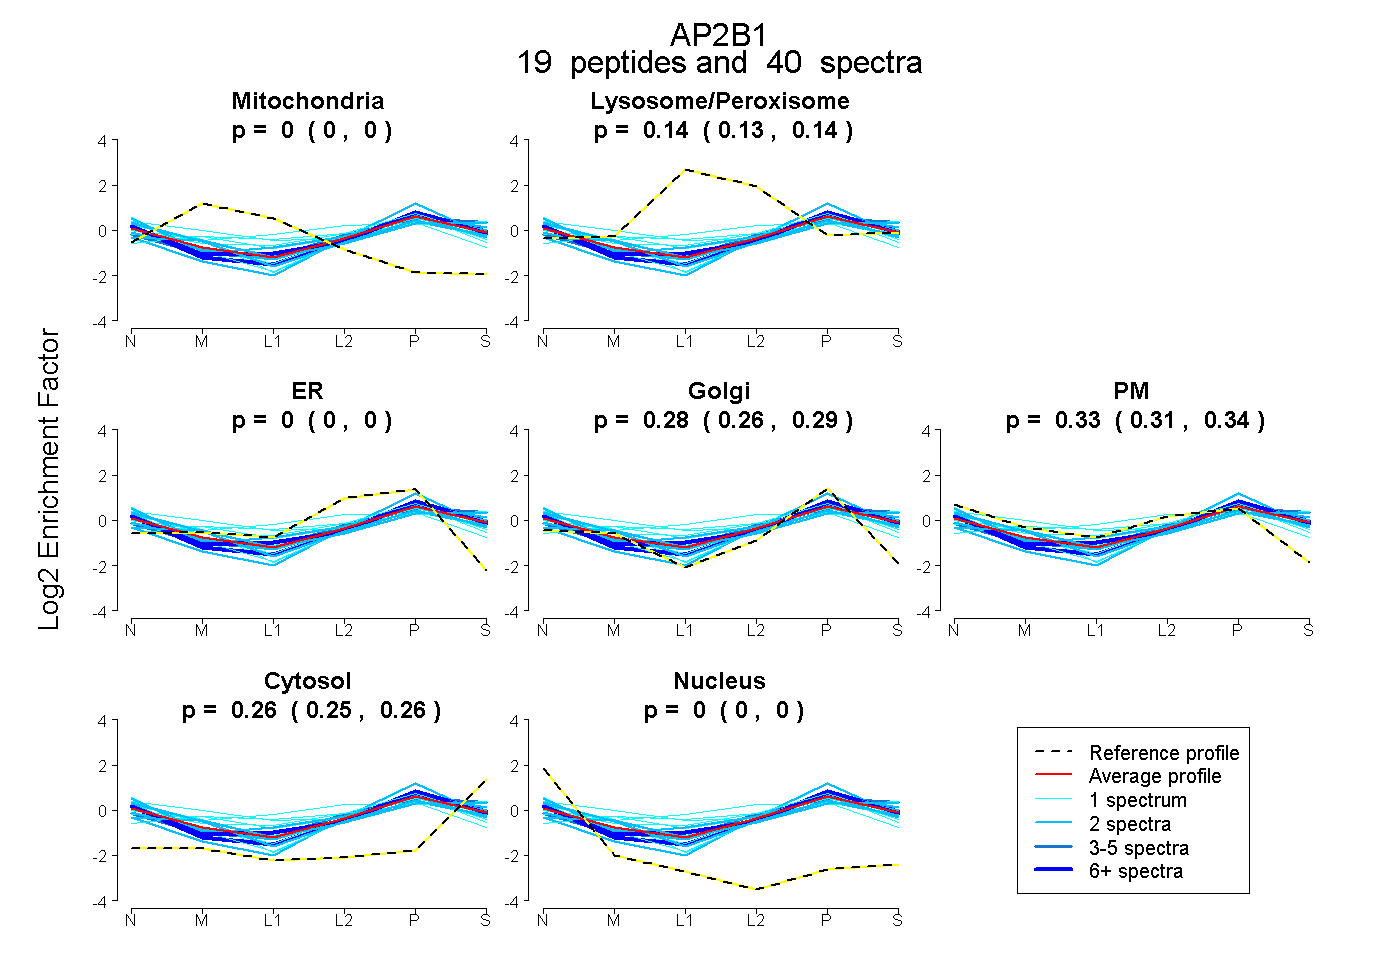
0.000 | 0.000
0.132 | 0.145
0.000 | 0.000
0.265 | 0.288
0.311 | 0.340
0.253 | 0.260
0.000 | 0.000
15peptides
spectra
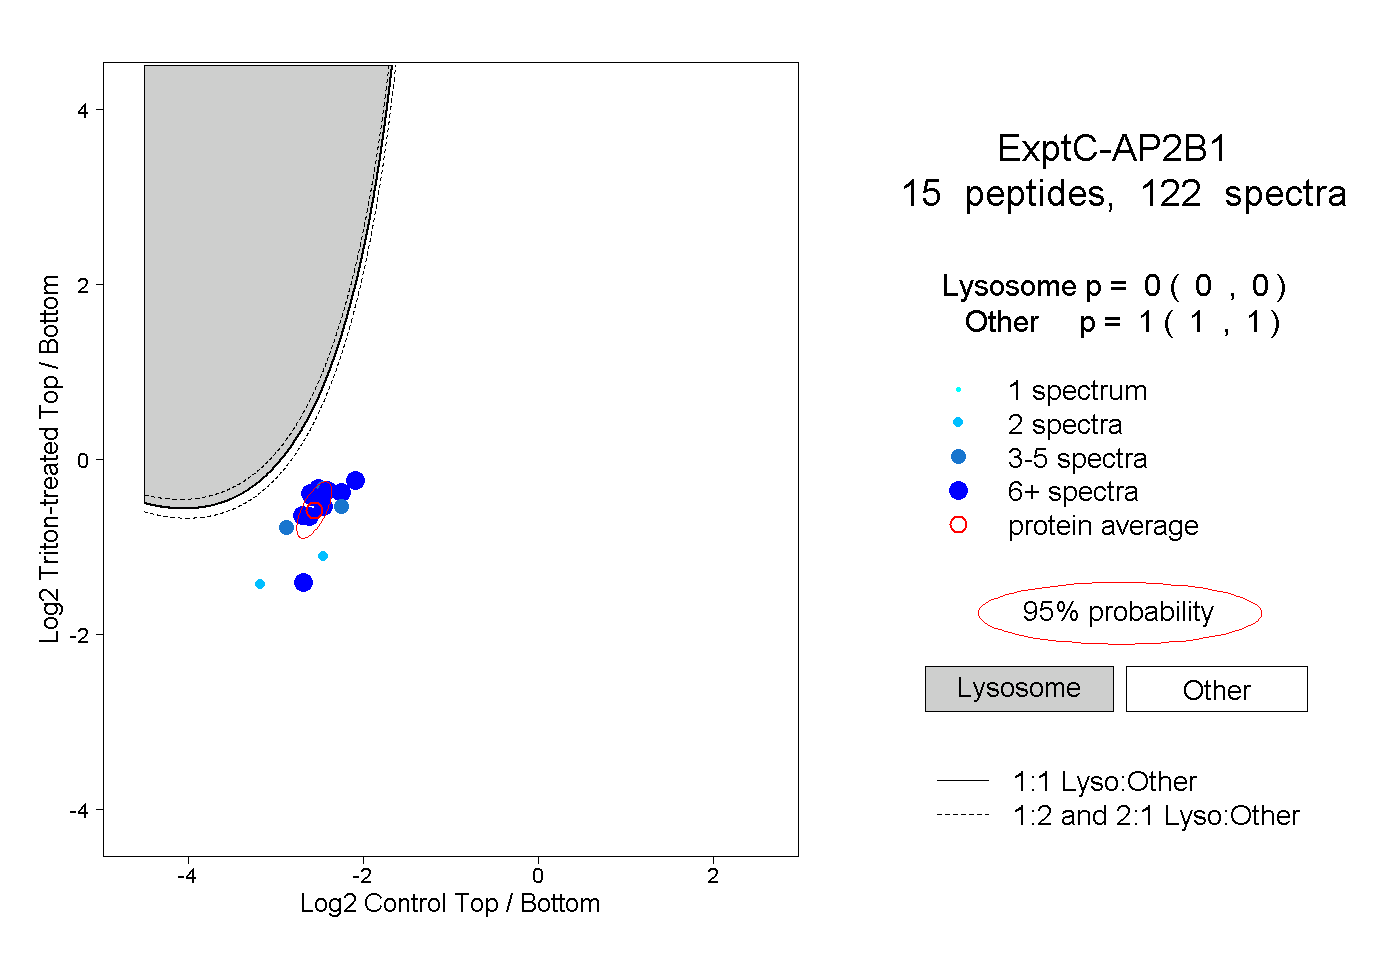
0.000 | 0.000
1.000 | 1.000
3peptides
spectra
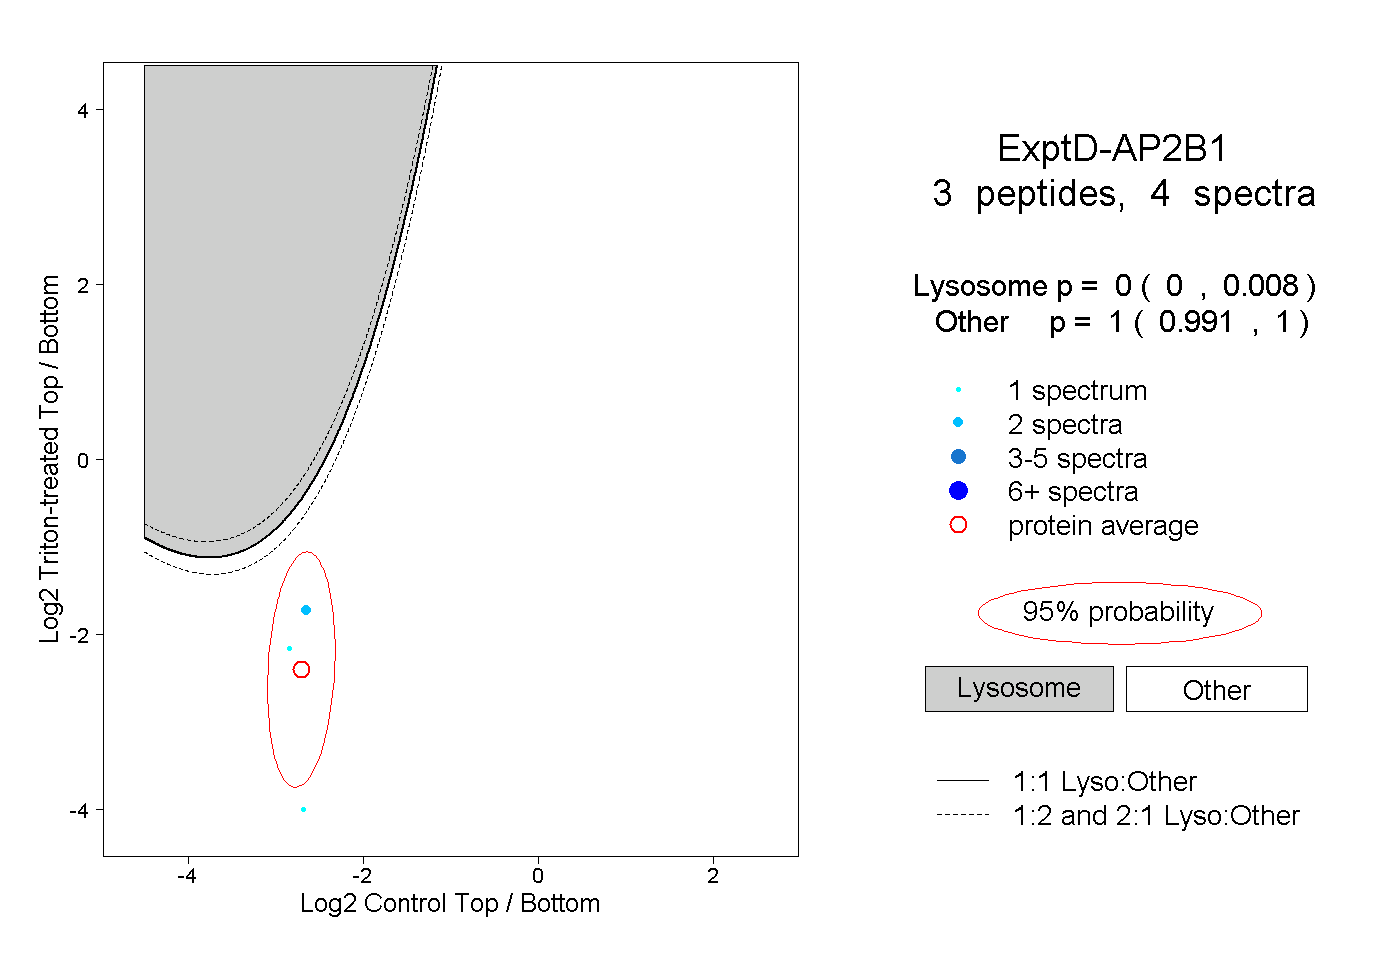
0.000 | 0.008
0.991 | 1.000