 7
7peptides
spectra
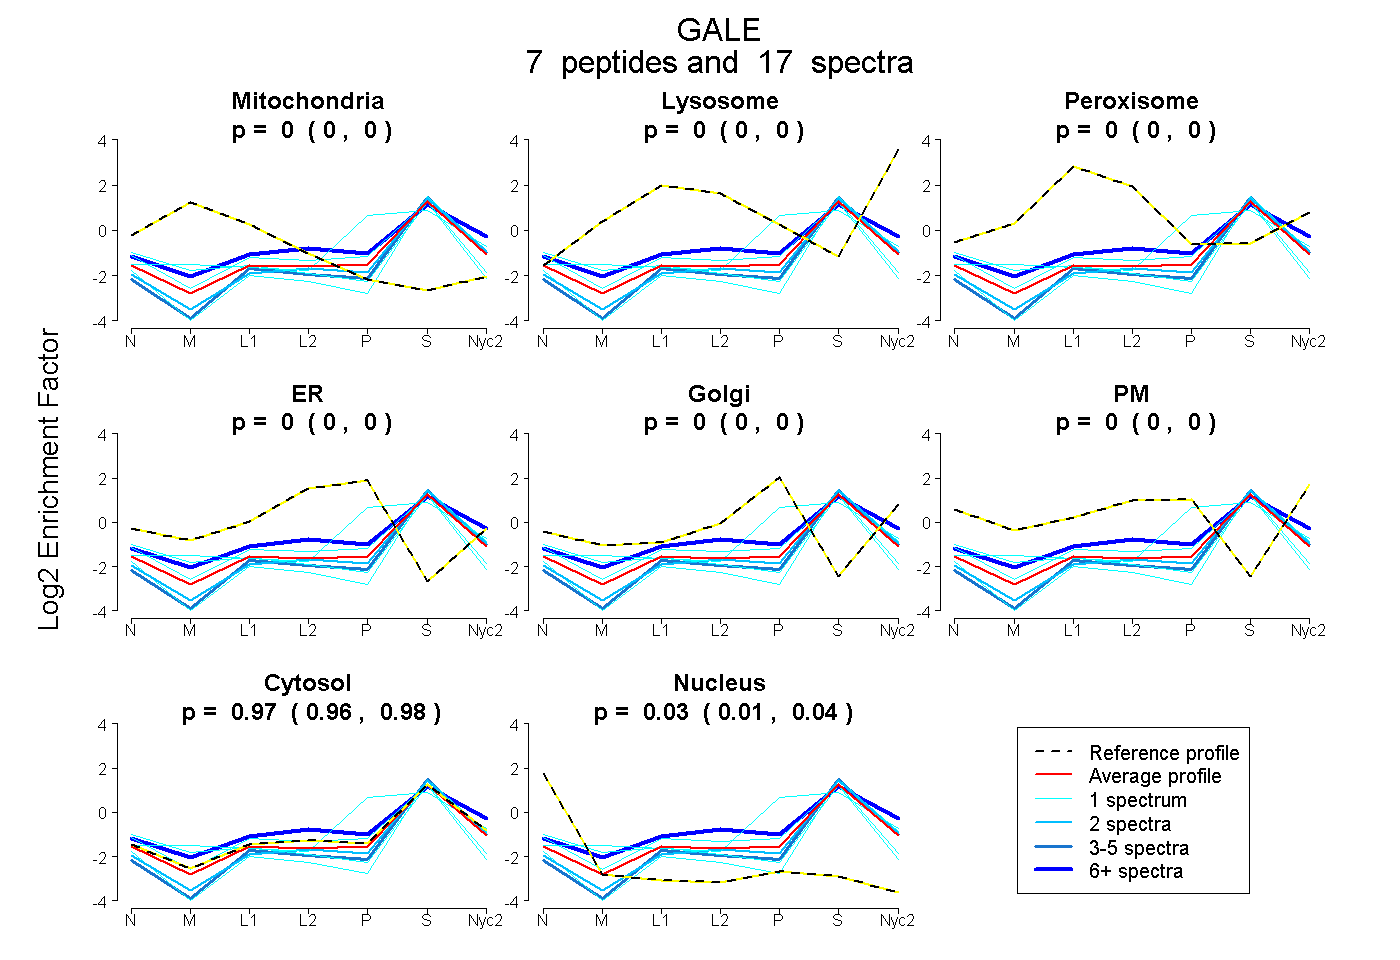
0.000 | 0.000
0.000 | 0.000
0.000 | 0.000
0.000 | 0.000
0.000 | 0.000
0.000 | 0.000
0.959 | 0.984
0.015 | 0.039
| Plot | Mito | Lyso | Perox | ER | Golgi | PM | Cytosol | Nucleus | |||||
| Expt A |
7 peptides |
17 spectra |
|
0.000 0.000 | 0.000 |
0.000 0.000 | 0.000 |
0.000 0.000 | 0.000 |
0.000 0.000 | 0.000 |
0.000 0.000 | 0.000 |
0.000 0.000 | 0.000 |
0.972 0.959 | 0.984 |
0.028 0.015 | 0.039 |
| 1 spectrum, EALNVFGDDYATEDGTGVR | 0.000 | 0.000 | 0.000 | 0.000 | 0.000 | 0.000 | 0.930 | 0.070 | ||
| 1 spectrum, MCEDLWR | 0.070 | 0.000 | 0.000 | 0.000 | 0.000 | 0.000 | 0.792 | 0.138 | ||
| 2 spectra, GEDSMPESLR | 0.000 | 0.000 | 0.000 | 0.000 | 0.000 | 0.000 | 0.991 | 0.009 | ||
| 1 spectrum, QNPSGFGAQA | 0.000 | 0.000 | 0.000 | 0.000 | 0.282 | 0.000 | 0.718 | 0.000 | ||
| 6 spectra, DYIHVVDLAK | 0.000 | 0.088 | 0.023 | 0.000 | 0.000 | 0.036 | 0.854 | 0.000 | ||
| 5 spectra, AVIHFAGLK | 0.000 | 0.000 | 0.000 | 0.000 | 0.000 | 0.000 | 0.996 | 0.004 | ||
| 1 spectrum, FFIEEMIQDLCR | 0.001 | 0.000 | 0.000 | 0.005 | 0.000 | 0.000 | 0.920 | 0.074 |
| Plot | Mito | Lyso or Perox | ER | Golgi | PM | Cytosol | Nucleus | ||||||
| Expt B |
1 peptide |
2 spectra |
 |
0.000 NA | NA |
0.096 NA | NA |
0.000 NA | NA |
0.000 NA | NA |
0.000 NA | NA |
0.904 NA | NA |
0.000 NA | NA |
|||
| Plot | Lyso | Other | |||||||||||
| Expt C |
3 peptides |
9 spectra |
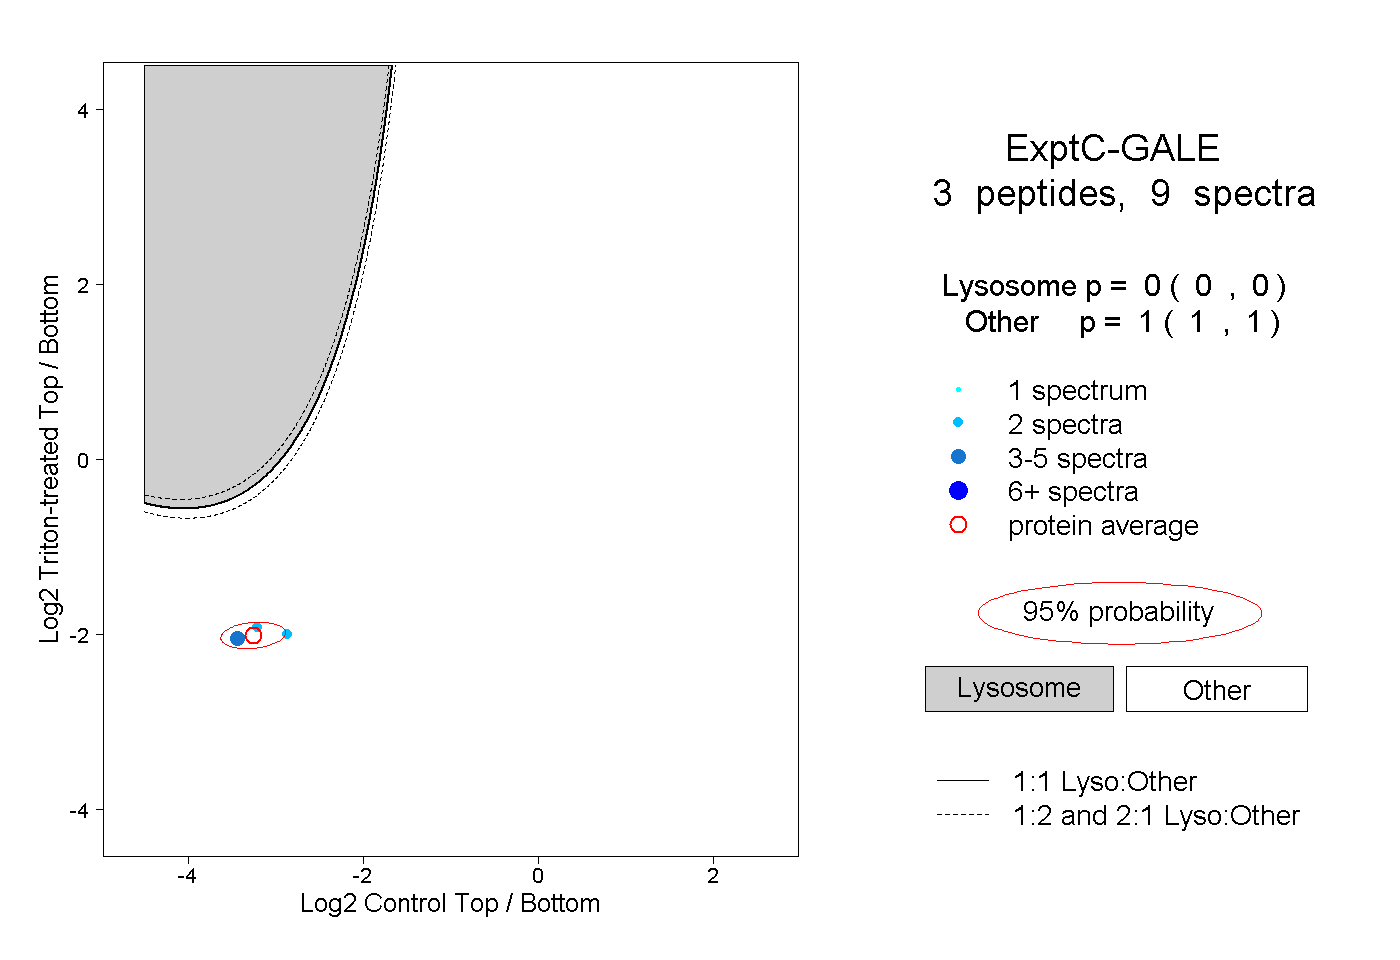 |
0.000 0.000 | 0.000 |
1.000 1.000 | 1.000 |