16
16peptides
spectra
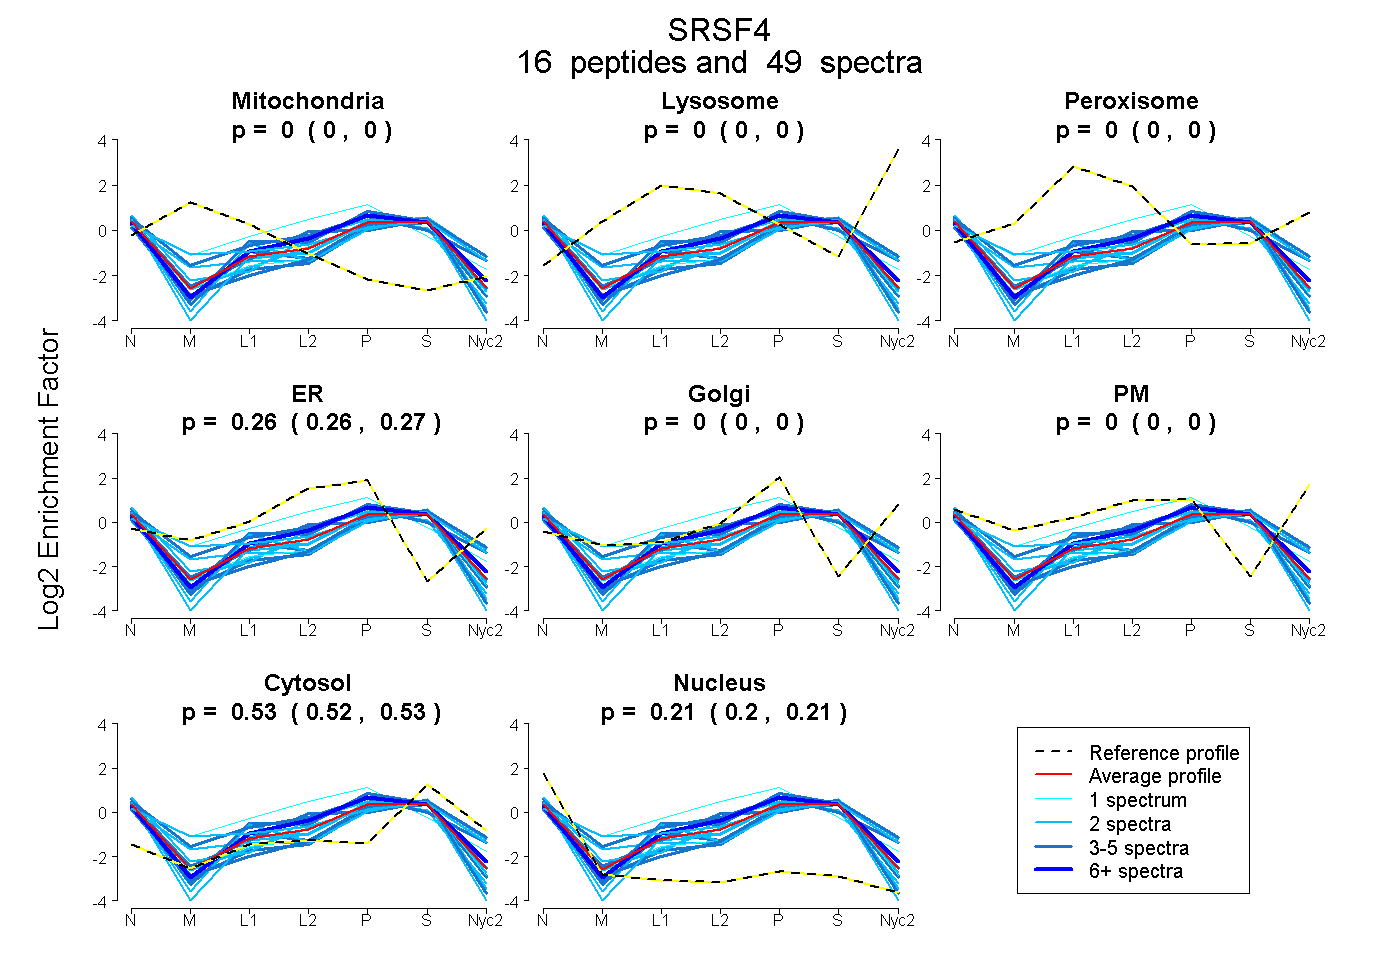
0.000 | 0.000
0.000 | 0.000
0.000 | 0.000
0.259 | 0.268
0.000 | 0.000
0.000 | 0.000
0.522 | 0.531
0.204 | 0.214
5peptides
spectra
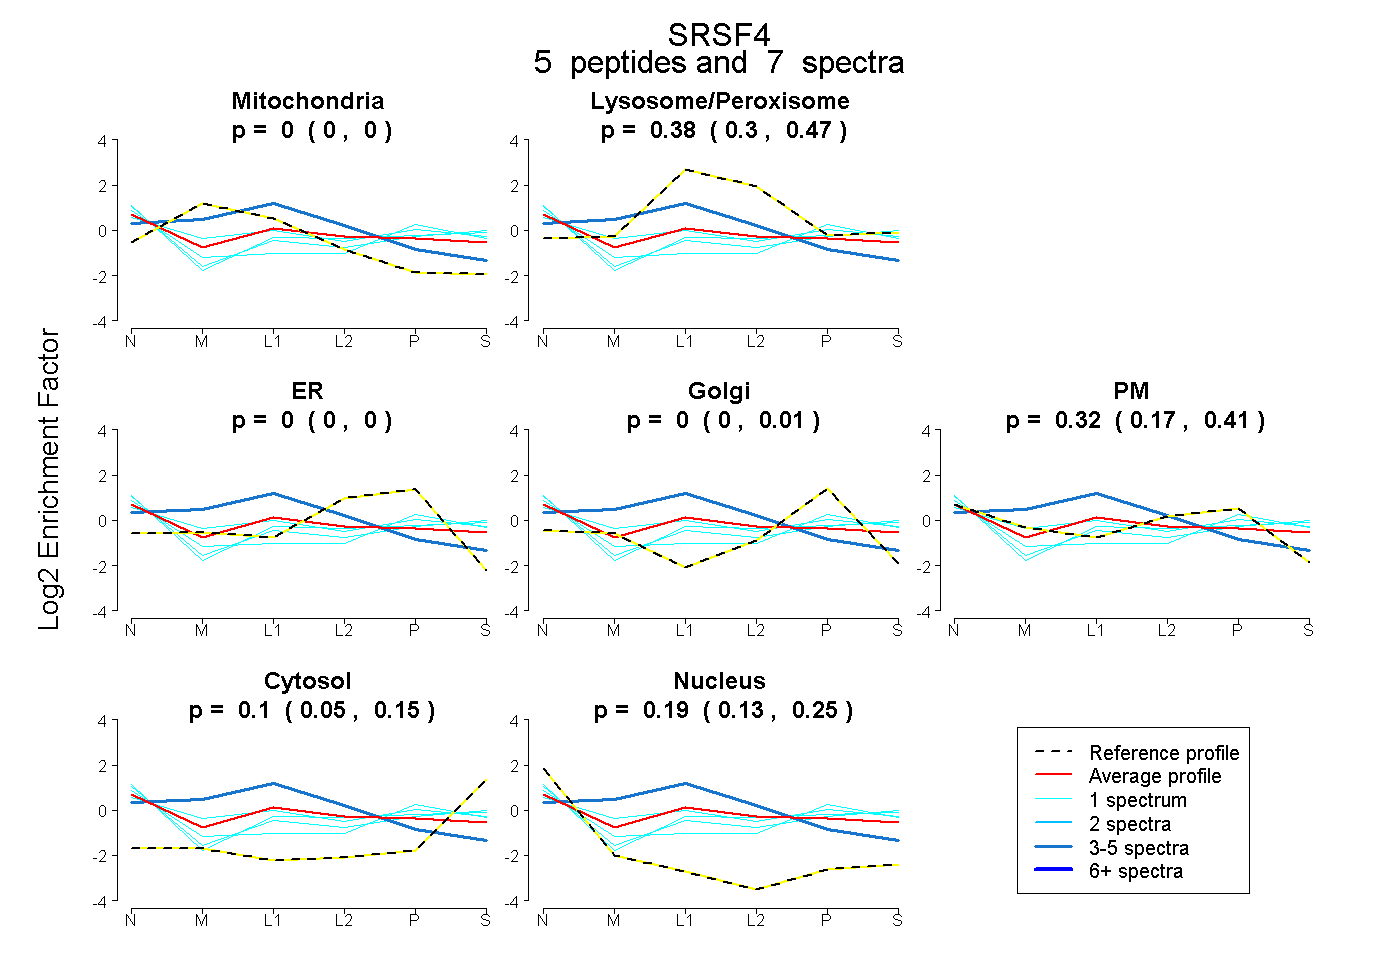
0.000 | 0.000
0.302 | 0.469
0.000 | 0.000
0.000 | 0.010
0.167 | 0.405
0.047 | 0.148
0.130 | 0.253