 16
16peptides
spectra
0.000 | 0.000
0.000 | 0.000
0.000 | 0.000
0.259 | 0.268
0.000 | 0.000
0.000 | 0.000
0.522 | 0.531
0.204 | 0.214
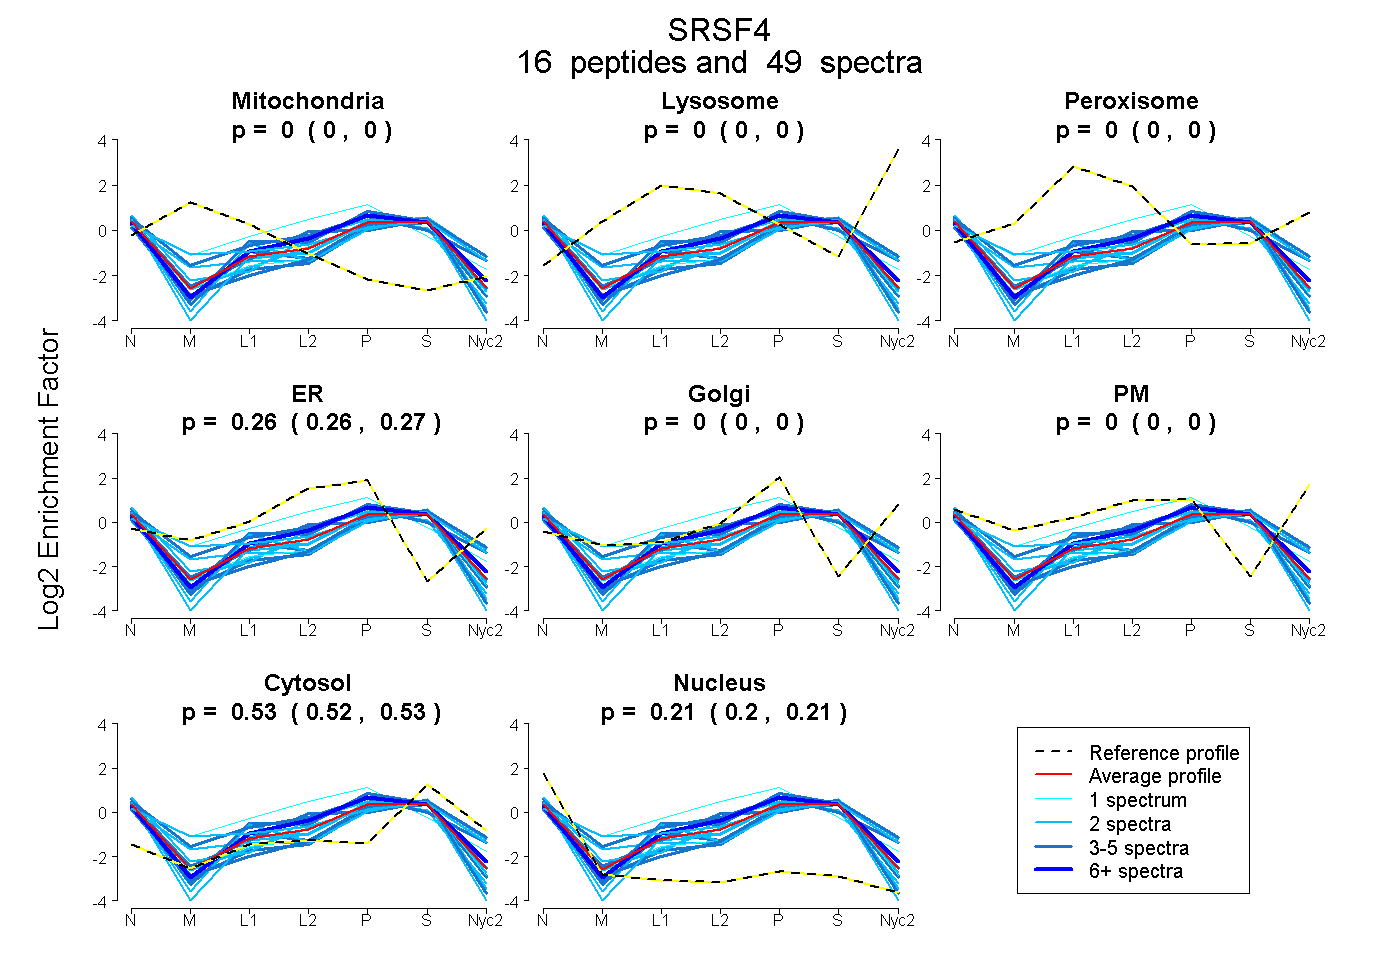
| Plot | Mito | Lyso | Perox | ER | Golgi | PM | Cytosol | Nucleus | |||||
| Expt A |
16 peptides |
49 spectra |
|
0.000 0.000 | 0.000 |
0.000 0.000 | 0.000 |
0.000 0.000 | 0.000 |
0.264 0.259 | 0.268 |
0.000 0.000 | 0.000 |
0.000 0.000 | 0.000 |
0.527 0.522 | 0.531 |
0.209 0.204 | 0.214 |
| 6 spectra, VSSSSSK | 0.000 | 0.000 | 0.000 | 0.323 | 0.000 | 0.000 | 0.534 | 0.143 | ||
| 2 spectra, YGPPTR | 0.052 | 0.000 | 0.041 | 0.294 | 0.000 | 0.000 | 0.534 | 0.080 | ||
| 2 spectra, VIVEHAR | 0.000 | 0.000 | 0.000 | 0.158 | 0.000 | 0.000 | 0.509 | 0.333 | ||
| 2 spectra, ILEVDLK | 0.008 | 0.000 | 0.000 | 0.176 | 0.000 | 0.000 | 0.534 | 0.281 | ||
| 2 spectra, LDGTEVNGR | 0.000 | 0.000 | 0.000 | 0.226 | 0.000 | 0.000 | 0.535 | 0.239 | ||
| 4 spectra, LIVENLSSR | 0.000 | 0.000 | 0.000 | 0.323 | 0.000 | 0.000 | 0.542 | 0.135 | ||
| 4 spectra, EHATAEPGQR | 0.000 | 0.000 | 0.000 | 0.310 | 0.000 | 0.000 | 0.601 | 0.089 | ||
| 2 spectra, LSYQAR | 0.000 | 0.000 | 0.000 | 0.312 | 0.000 | 0.000 | 0.393 | 0.295 | ||
| 1 spectrum, CSWQDLK | 0.000 | 0.000 | 0.042 | 0.564 | 0.000 | 0.000 | 0.343 | 0.051 | ||
| 5 spectra, DADDAVYELDGK | 0.000 | 0.000 | 0.000 | 0.172 | 0.000 | 0.000 | 0.556 | 0.273 | ||
| 5 spectra, DGSYGSGR | 0.000 | 0.000 | 0.000 | 0.148 | 0.000 | 0.000 | 0.523 | 0.330 | ||
| 4 spectra, SKPSLPAESR | 0.000 | 0.000 | 0.000 | 0.130 | 0.000 | 0.000 | 0.530 | 0.340 | ||
| 2 spectra, DADDAVYELNGK | 0.000 | 0.000 | 0.000 | 0.146 | 0.128 | 0.000 | 0.630 | 0.096 | ||
| 1 spectrum, NGYGFVEFDDLR | 0.000 | 0.000 | 0.000 | 0.179 | 0.000 | 0.000 | 0.552 | 0.268 | ||
| 2 spectra, LVEDKPGSR | 0.000 | 0.000 | 0.000 | 0.157 | 0.000 | 0.000 | 0.560 | 0.283 | ||
| 5 spectra, QAGEVTYADAHK | 0.000 | 0.000 | 0.029 | 0.433 | 0.000 | 0.000 | 0.430 | 0.108 |
| Plot | Mito | Lyso or Perox | ER | Golgi | PM | Cytosol | Nucleus | ||||||
| Expt B |
5 peptides |
7 spectra |
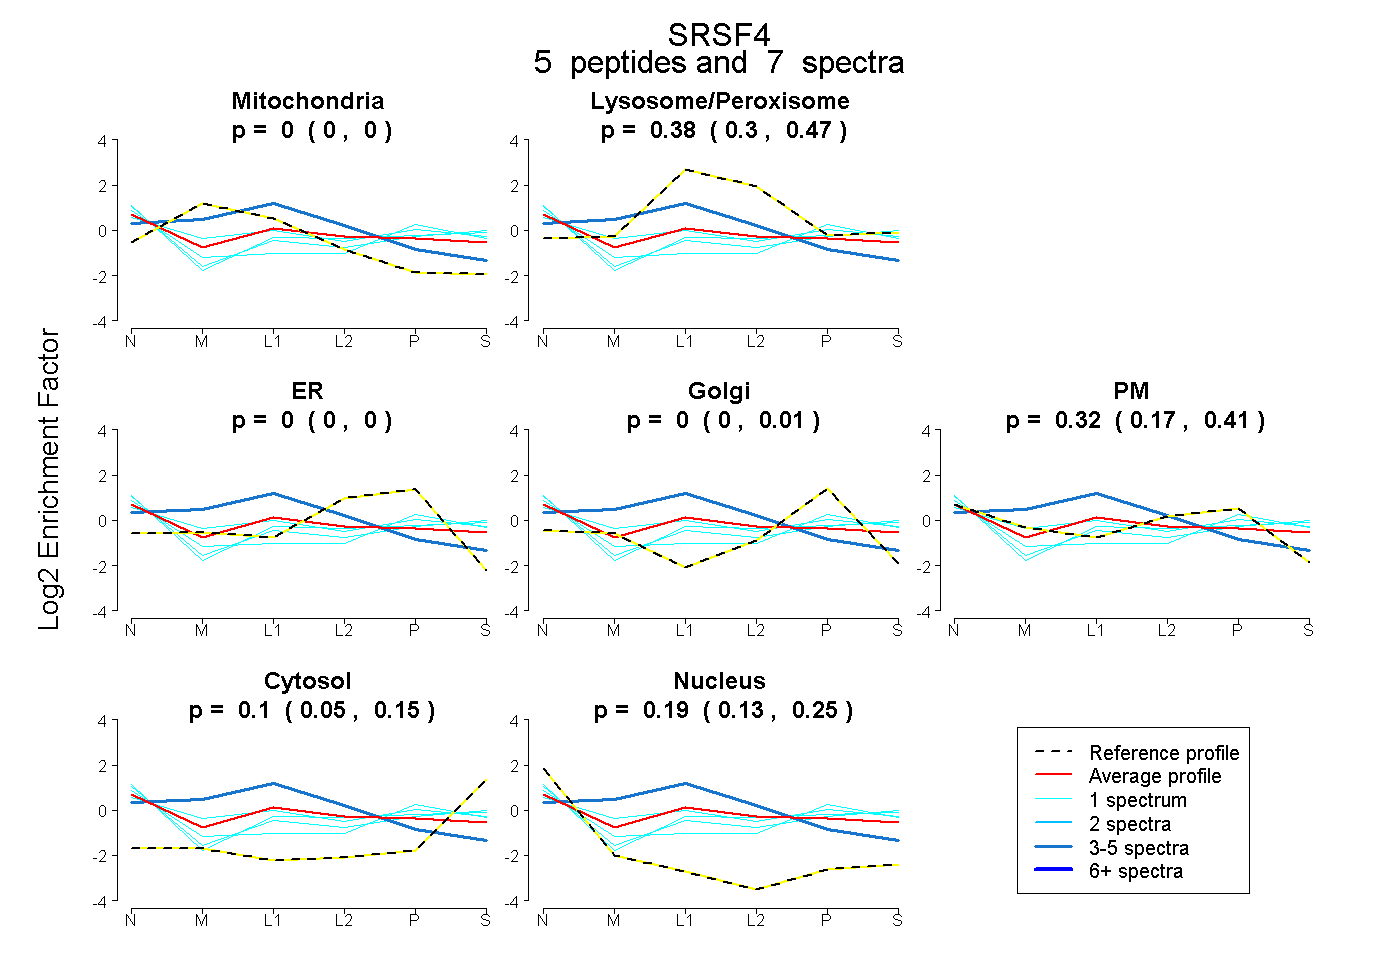 |
0.000 0.000 | 0.000 |
0.385 0.302 | 0.469 |
0.000 0.000 | 0.000 |
0.000 0.000 | 0.010 |
0.316 0.167 | 0.405 |
0.105 0.047 | 0.148 |
0.194 0.130 | 0.253 |
|||
| Plot | Lyso | Other | |||||||||||
| Expt C |
5 peptides |
11 spectra |
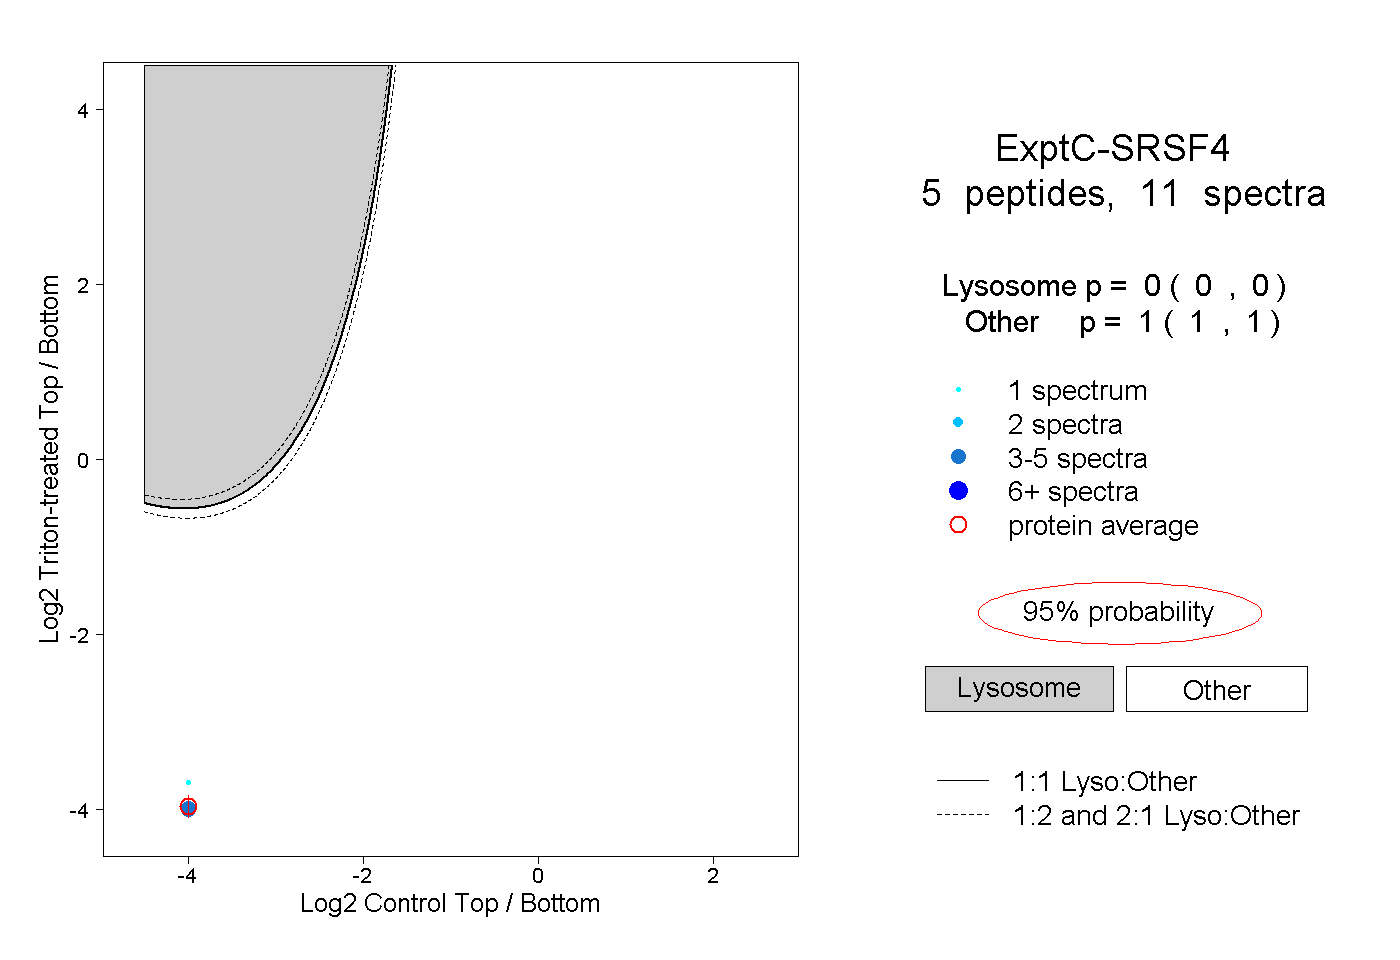 |
0.000 0.000 | 0.000 |
1.000 1.000 | 1.000 |
||||||||
| Plot | Lyso | Other | |||||||||||
| Expt D |
4 peptides |
9 spectra |
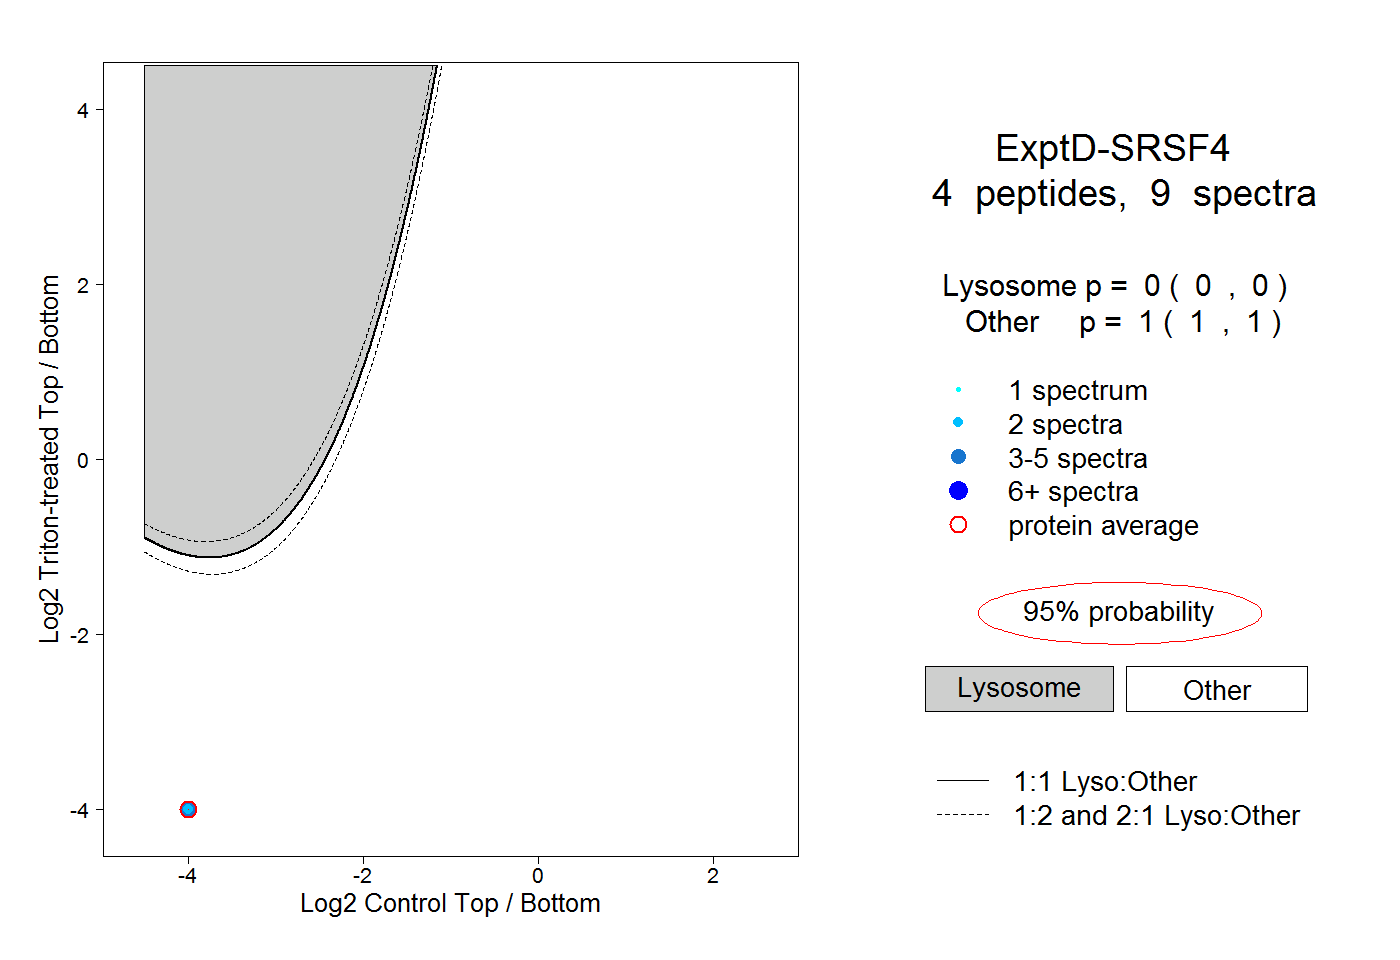 |
0.000 0.000 | 0.000 |
1.000 1.000 | 1.000 |