 5
5peptides
spectra
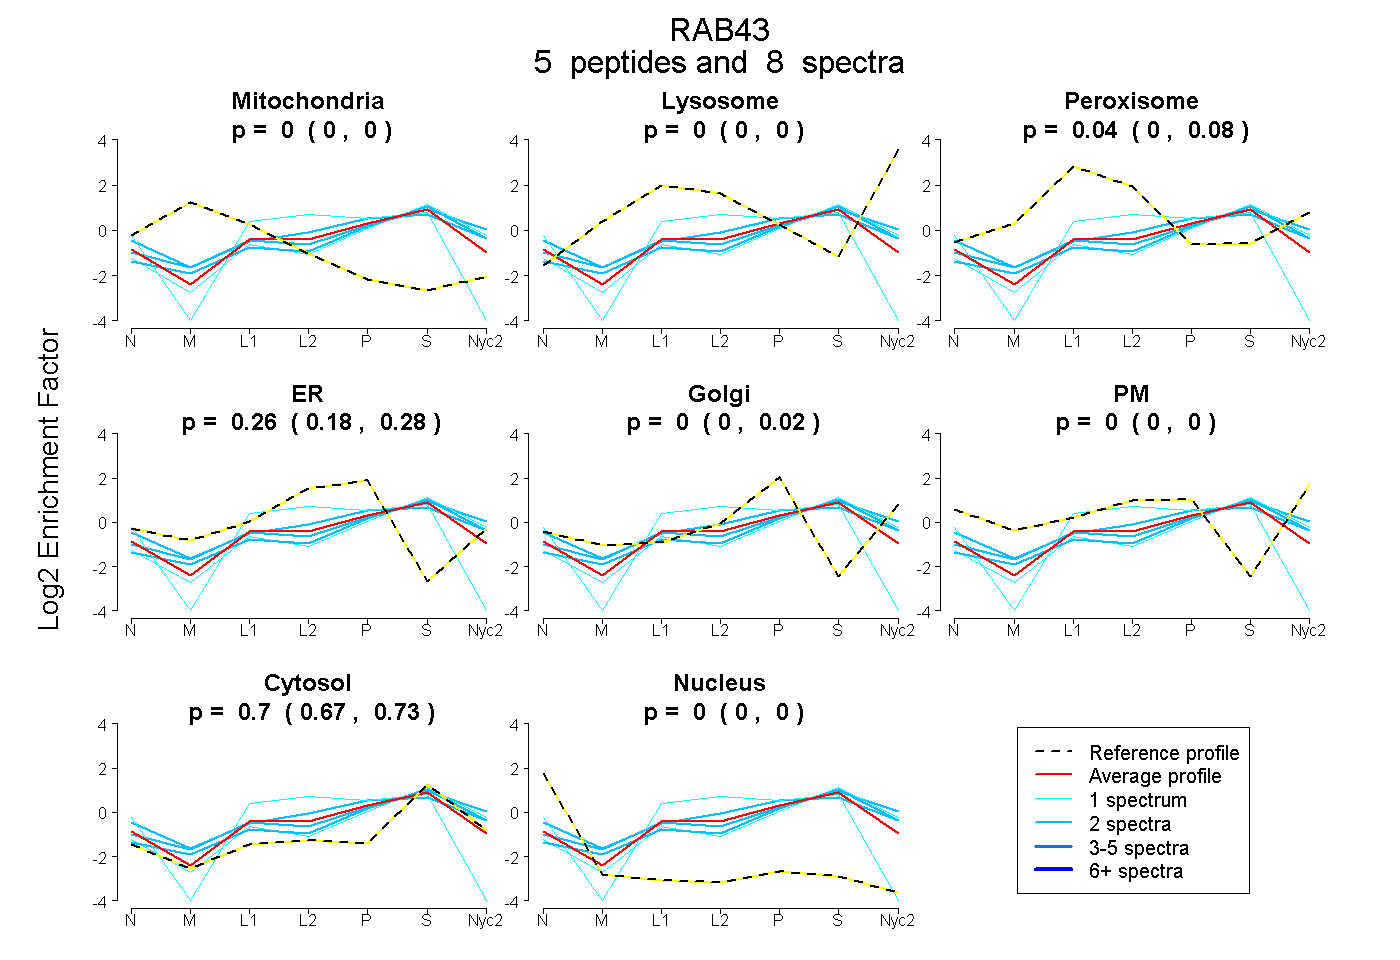
0.000 | 0.000
0.000 | 0.000
0.000 | 0.084
0.183 | 0.278
0.000 | 0.015
0.000 | 0.000
0.667 | 0.729
0.000 | 0.000
1peptide
spectra
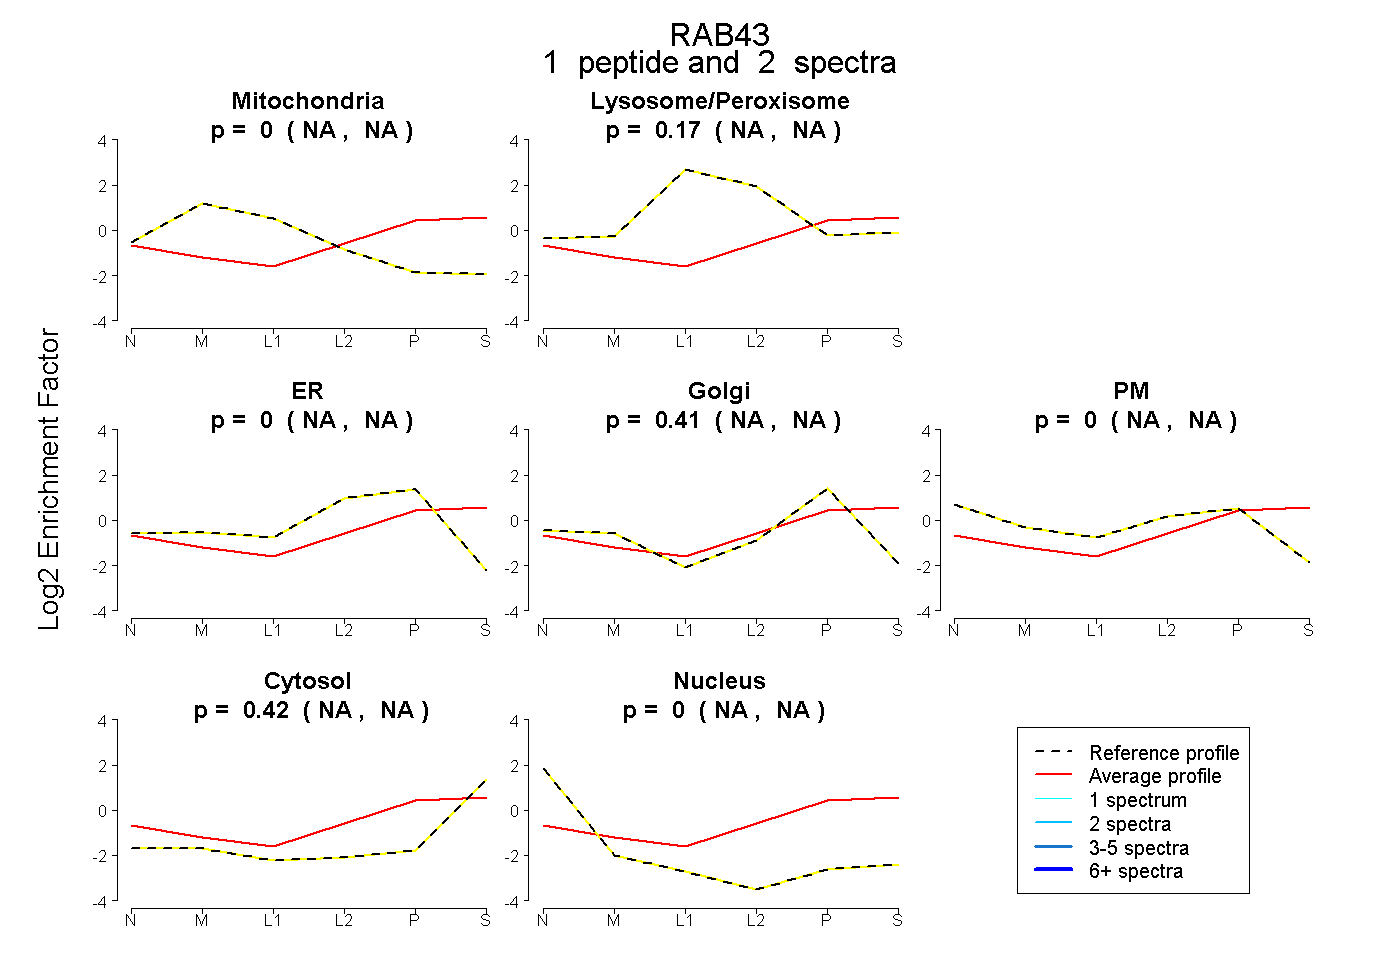
NA | NA
NA | NA
NA | NA
NA | NA
NA | NA
NA | NA
NA | NA
4peptides
spectra
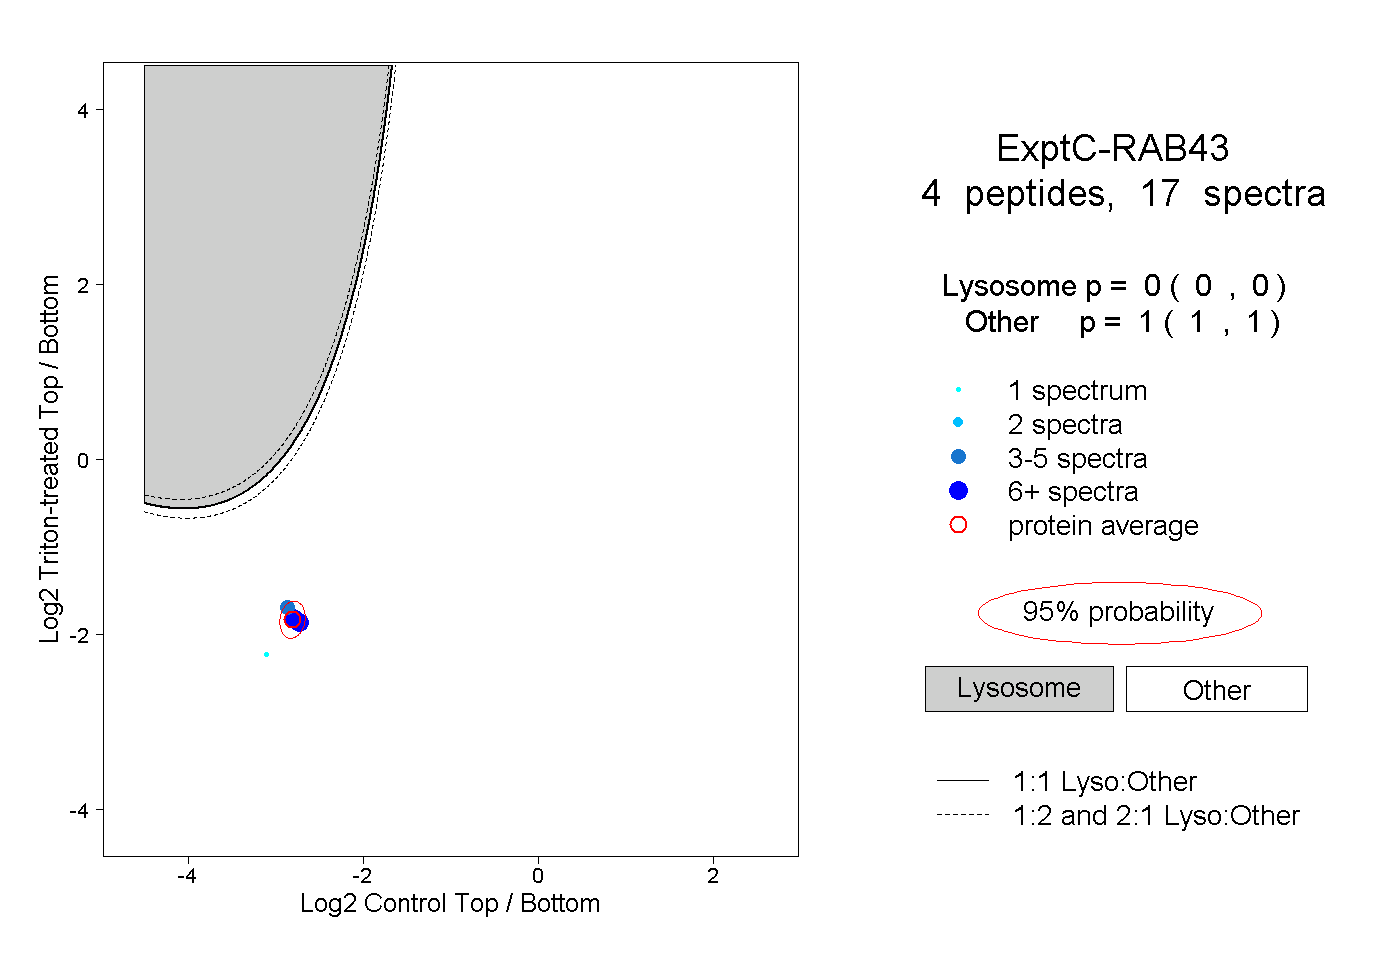
0.000 | 0.000
1.000 | 1.000