 29
29peptides
spectra
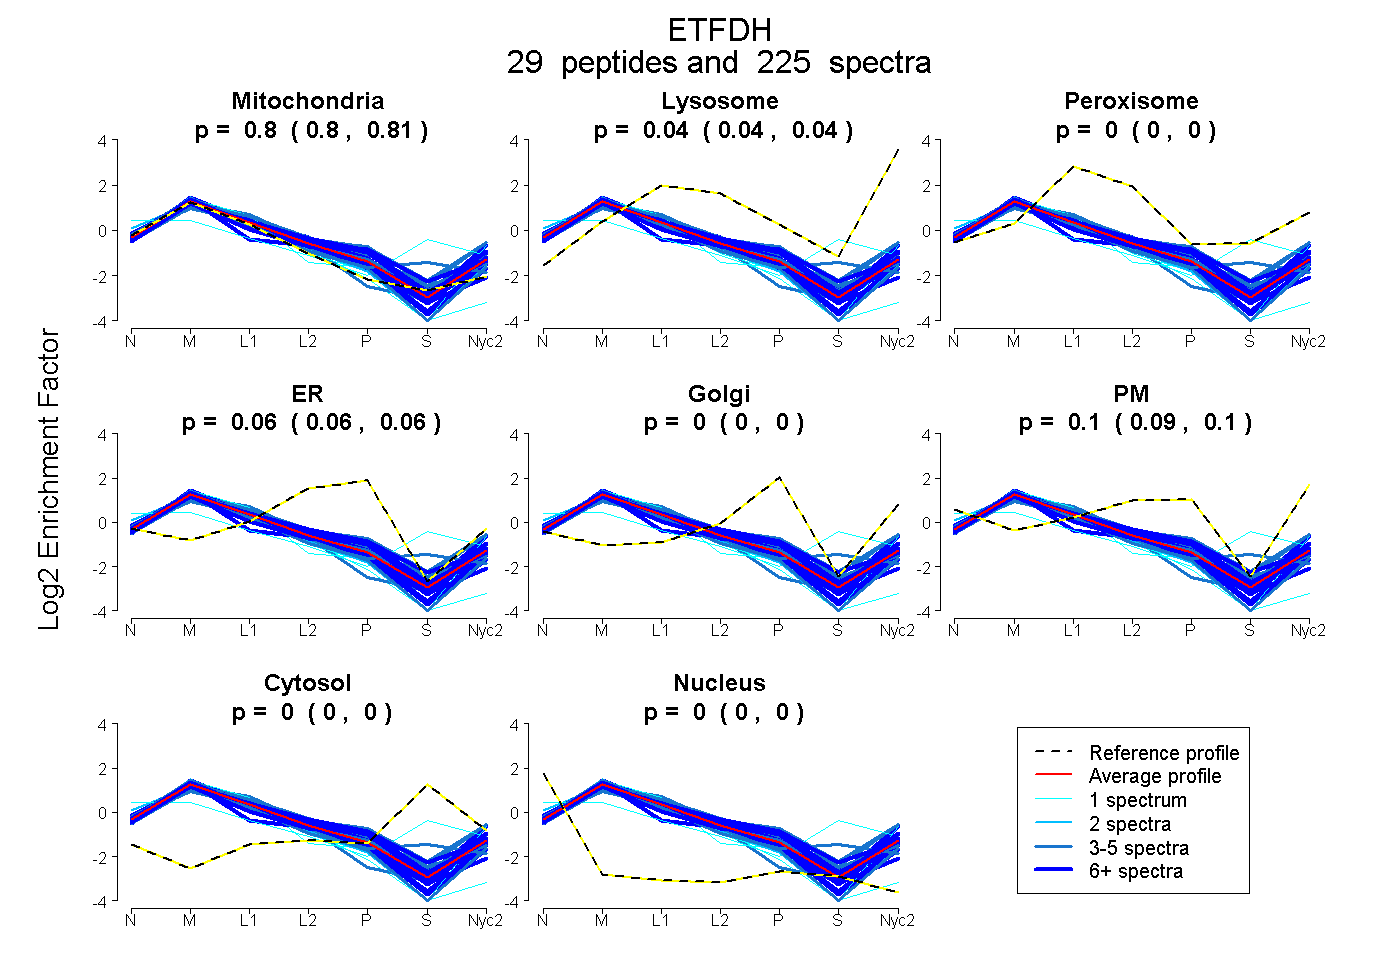
0.803 | 0.805
0.037 | 0.040
0.000 | 0.000
0.056 | 0.062
0.000 | 0.000
0.094 | 0.101
0.000 | 0.000
0.000 | 0.000
20peptides
spectra
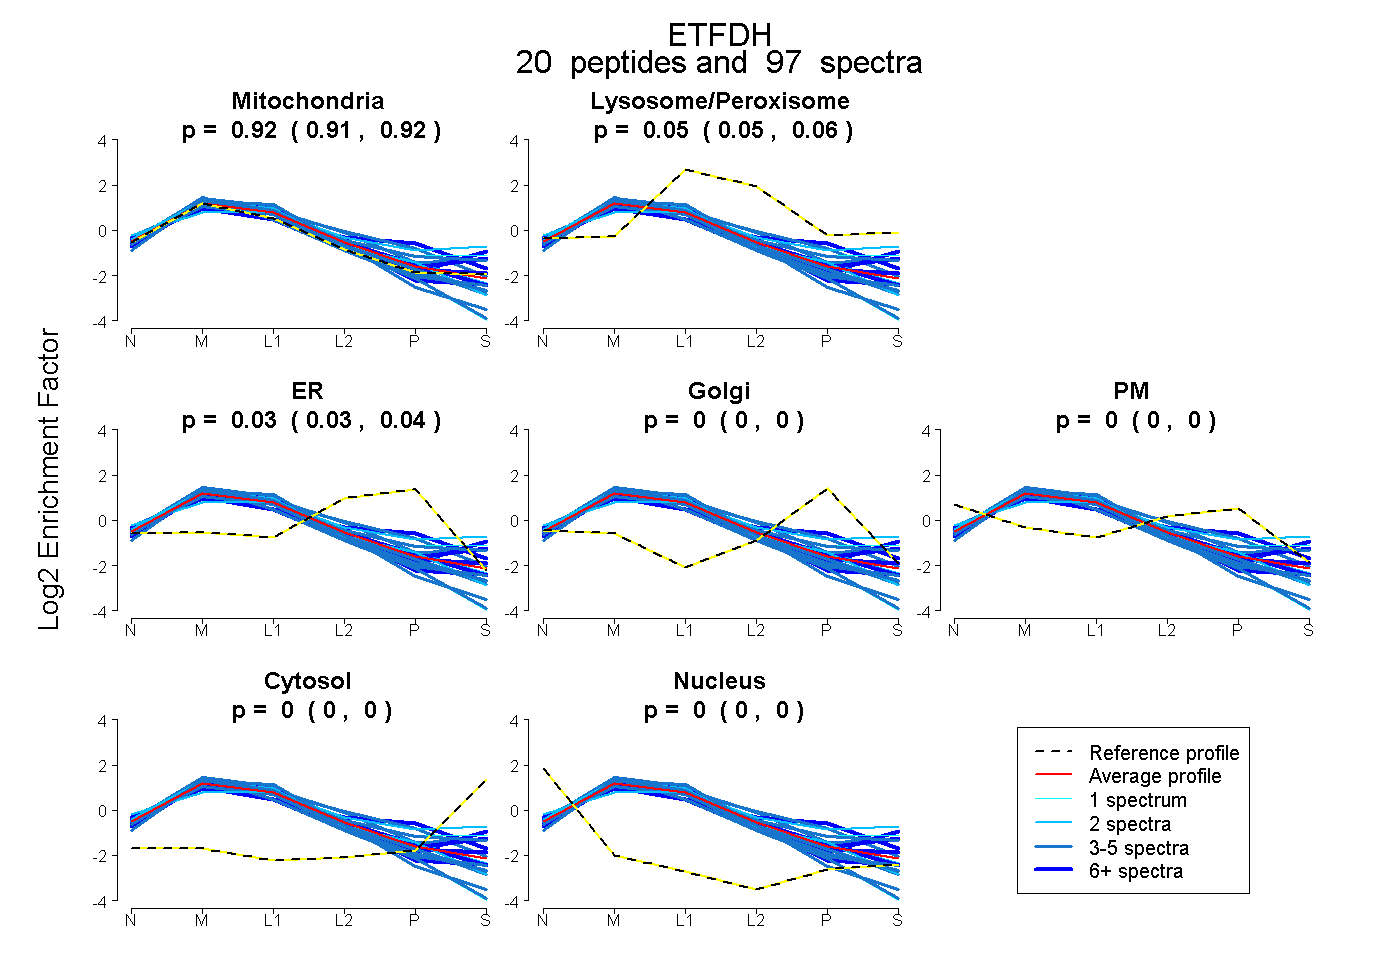
0.911 | 0.919
0.048 | 0.057
0.026 | 0.036
0.000 | 0.000
0.000 | 0.000
0.000 | 0.000
0.000 | 0.000
31peptides
spectra
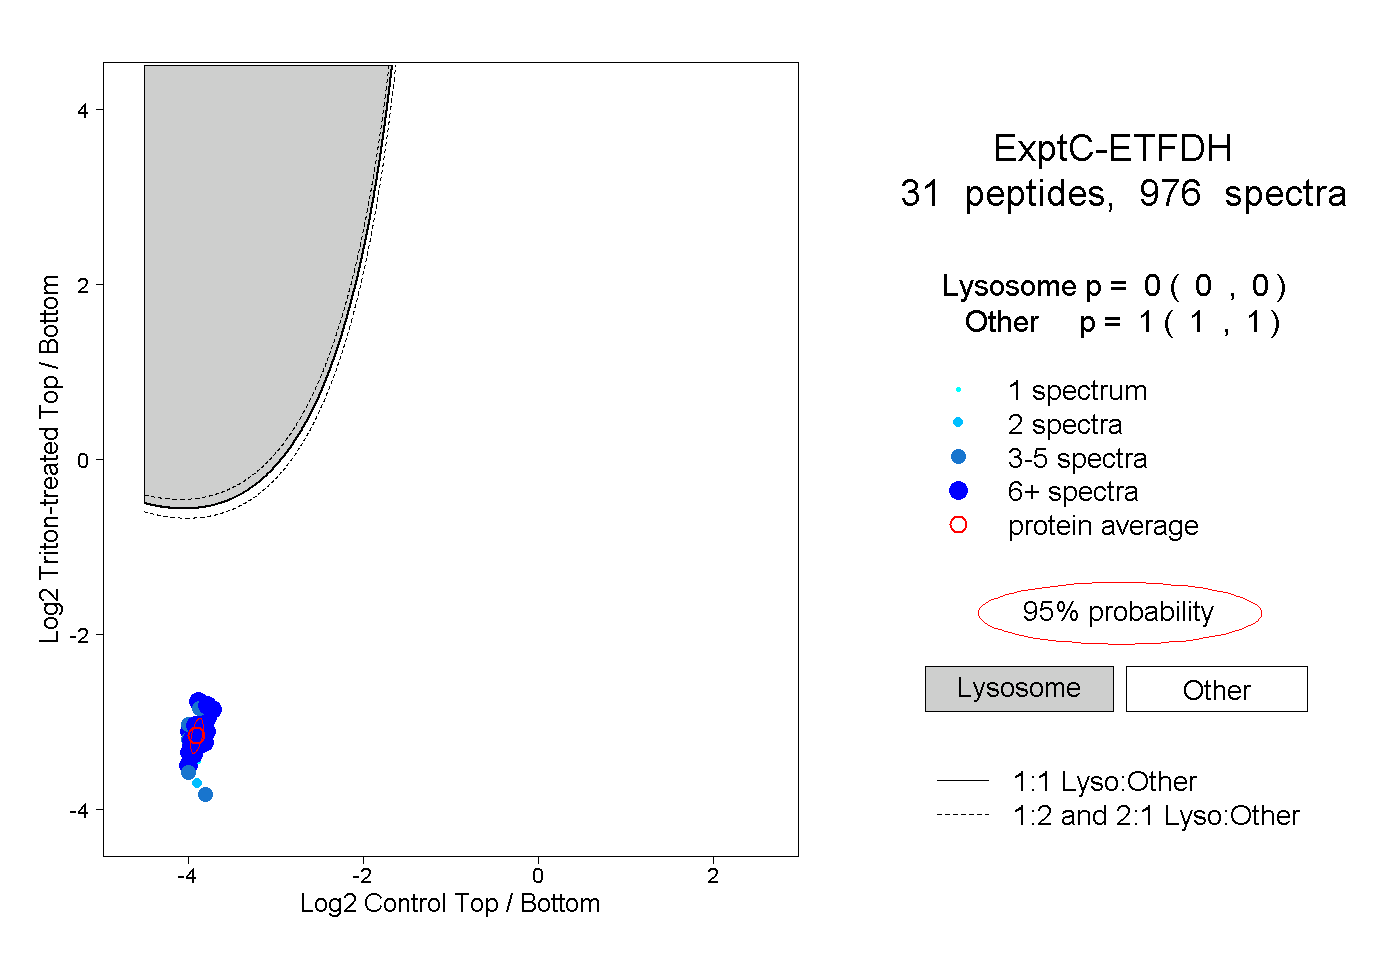
0.000 | 0.000
1.000 | 1.000
19peptides
spectra
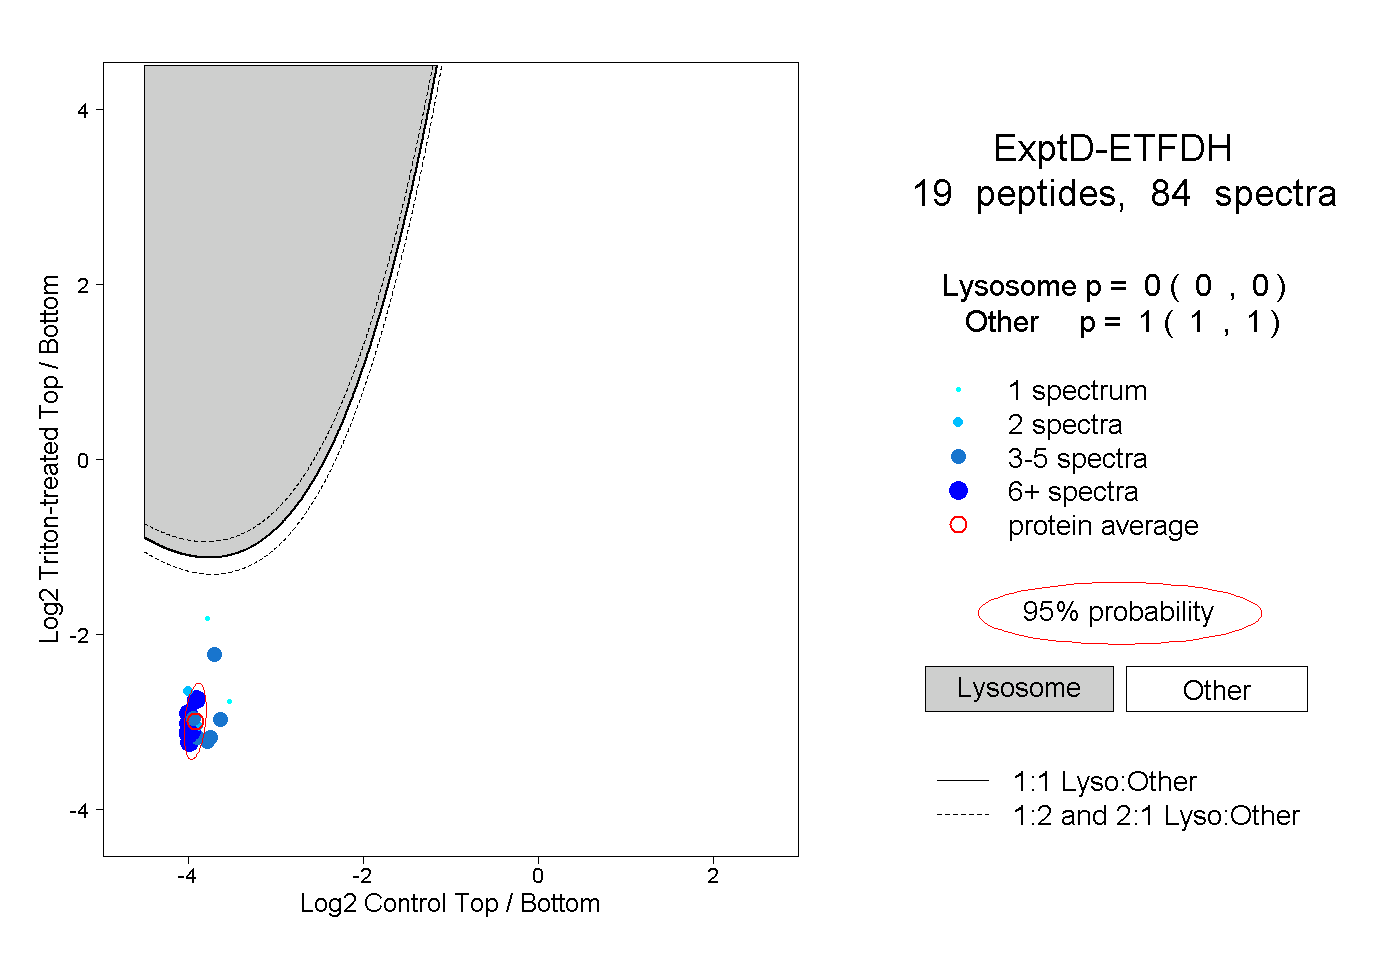
0.000 | 0.000
1.000 | 1.000