 10
10peptides
spectra
0.939 | 0.952
0.000 | 0.000
0.000 | 0.000
0.000 | 0.000
0.000 | 0.000
0.000 | 0.000
0.000 | 0.000
0.047 | 0.060
| Plot | Mito | Lyso | Perox | ER | Golgi | PM | Cytosol | Nucleus | |||||
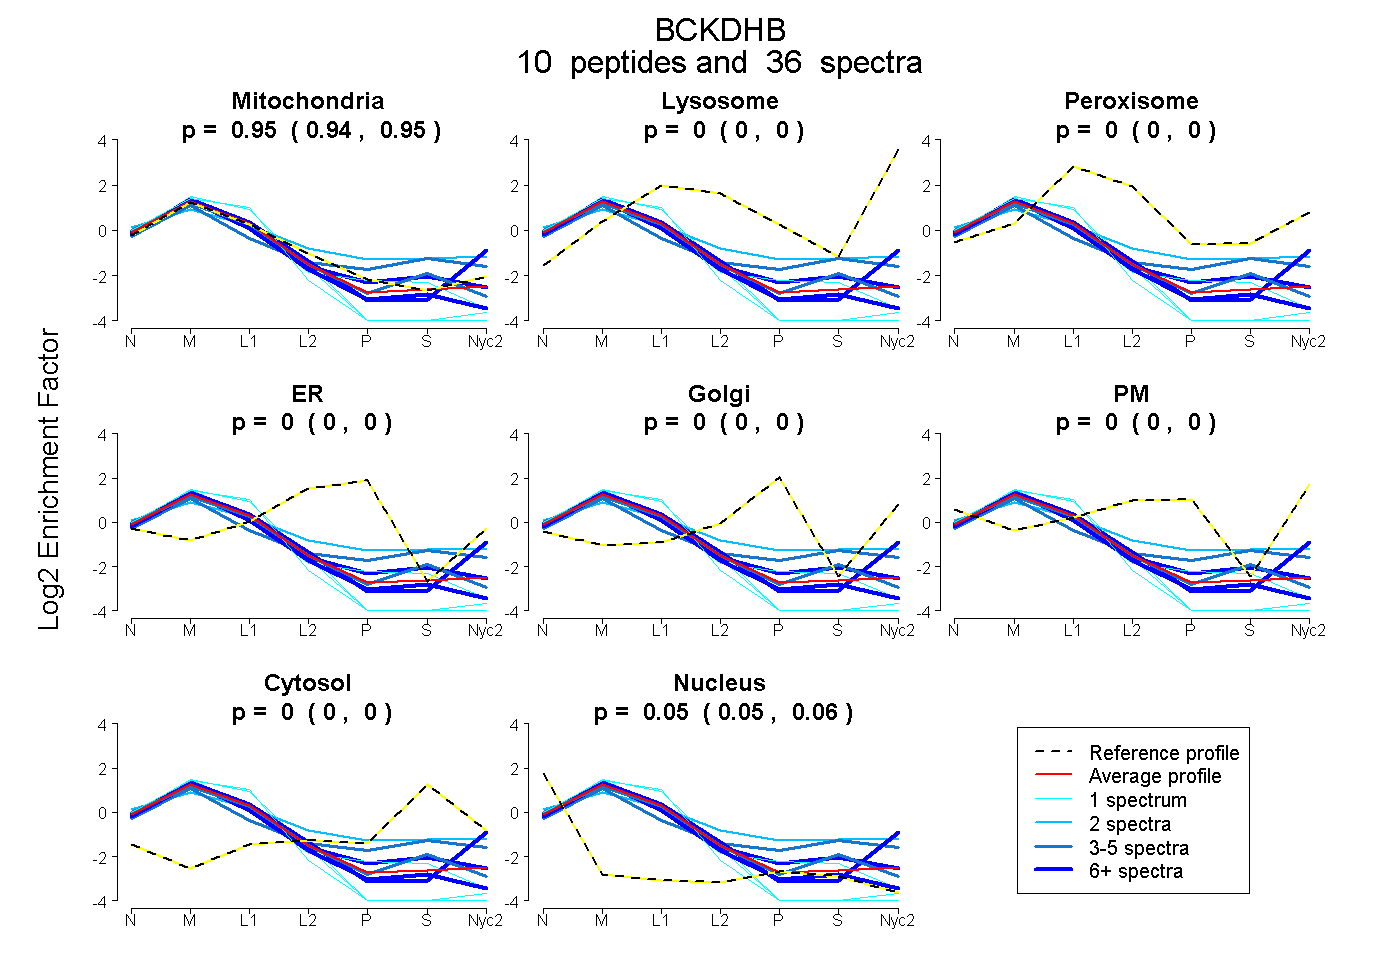
| Expt A |
10 peptides |
36 spectra |
|
0.946 0.939 | 0.952 |
0.000 0.000 | 0.000 |
0.000 0.000 | 0.000 |
0.000 0.000 | 0.000 |
0.000 0.000 | 0.000 |
0.000 0.000 | 0.000 |
0.000 0.000 | 0.000 |
0.054 0.047 | 0.060 |
| 1 spectrum, VAHFTFQPDPESLQYGQTQK | 0.898 | 0.000 | 0.000 | 0.000 | 0.000 | 0.000 | 0.000 | 0.102 | ||
| 5 spectra, TIVPWDVDTVCK | 0.910 | 0.000 | 0.000 | 0.000 | 0.000 | 0.000 | 0.004 | 0.086 | ||
| 2 spectra, AAVEQVPVEPYK | 0.630 | 0.000 | 0.112 | 0.000 | 0.000 | 0.101 | 0.157 | 0.000 | ||
| 1 spectrum, APWGCVGHGALYHSQSPEAFFAHCPGIK | 0.936 | 0.000 | 0.000 | 0.000 | 0.000 | 0.000 | 0.000 | 0.064 | ||
| 6 spectra, EVASMAQEK | 0.926 | 0.000 | 0.000 | 0.000 | 0.000 | 0.000 | 0.032 | 0.042 | ||
| 7 spectra, LGVSCEVIDLR | 0.879 | 0.000 | 0.000 | 0.000 | 0.000 | 0.000 | 0.000 | 0.121 | ||
| 9 spectra, SGDLFNCGSLTIR | 0.955 | 0.045 | 0.000 | 0.000 | 0.000 | 0.000 | 0.000 | 0.000 | ||
| 3 spectra, CYDALR | 0.771 | 0.004 | 0.000 | 0.000 | 0.000 | 0.000 | 0.225 | 0.000 | ||
| 1 spectrum, DPTAVIFGEDVAFGGVFR | 0.900 | 0.000 | 0.000 | 0.000 | 0.000 | 0.000 | 0.000 | 0.100 | ||
| 1 spectrum, GLLLSCIEDK | 0.893 | 0.000 | 0.000 | 0.000 | 0.000 | 0.000 | 0.000 | 0.107 |
| Plot | Mito | Lyso or Perox | ER | Golgi | PM | Cytosol | Nucleus | ||||||
| Expt B |
8 peptides |
21 spectra |
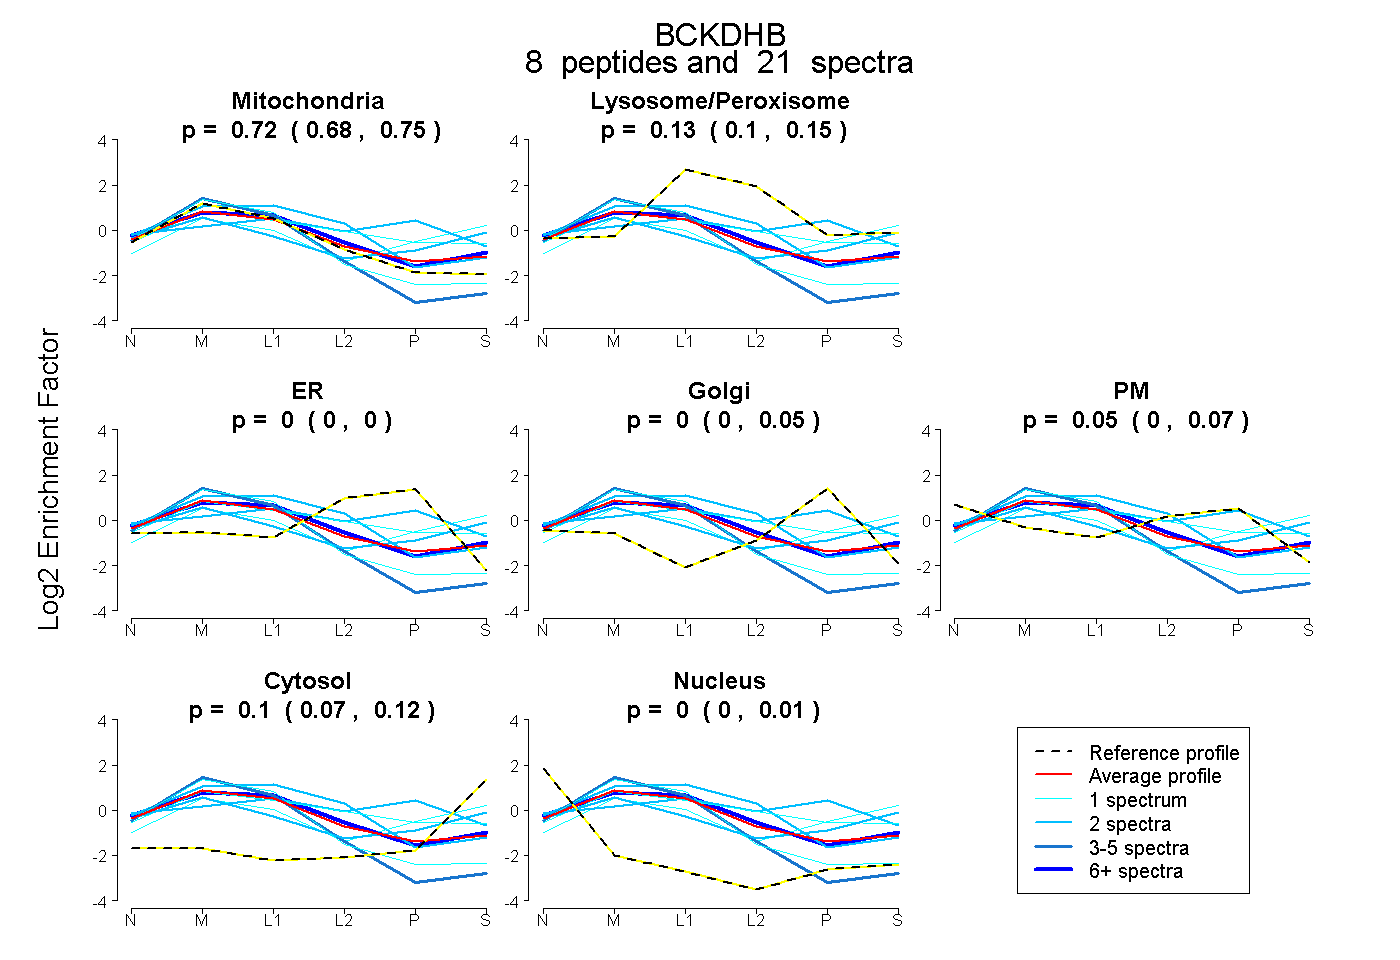 |
0.717 0.676 | 0.753 |
0.126 0.103 | 0.150 |
0.000 0.000 | 0.000 |
0.000 0.000 | 0.047 |
0.054 0.001 | 0.073 |
0.103 0.072 | 0.124 |
0.000 0.000 | 0.005 |
|||
| Plot | Lyso | Other | |||||||||||
| Expt C |
13 peptides |
167 spectra |
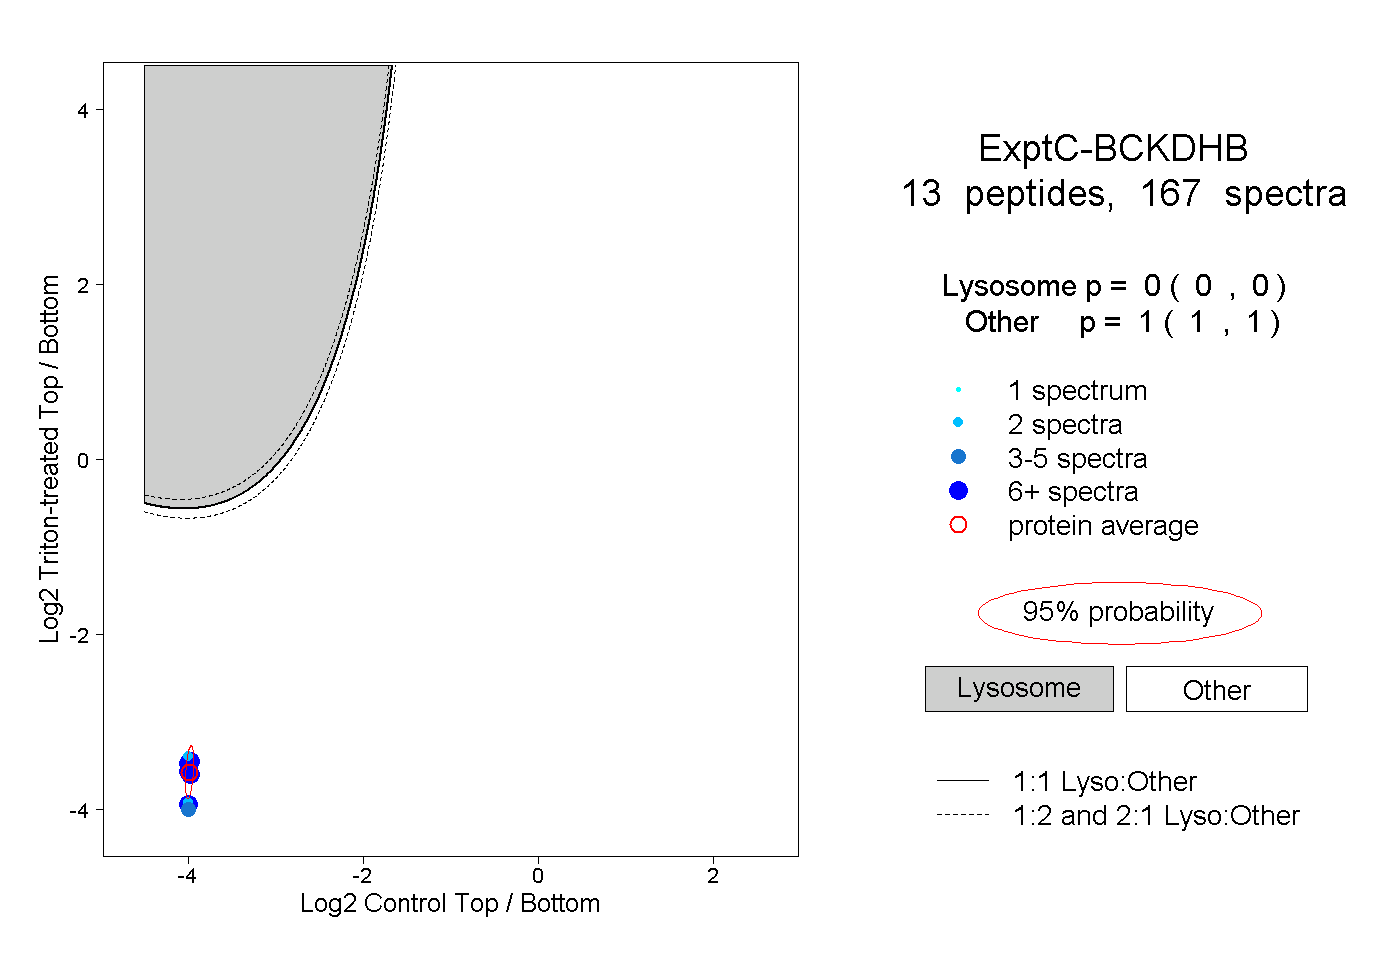 |
0.000 0.000 | 0.000 |
1.000 1.000 | 1.000 |
||||||||
| Plot | Lyso | Other | |||||||||||
| Expt D |
6 peptides |
14 spectra |
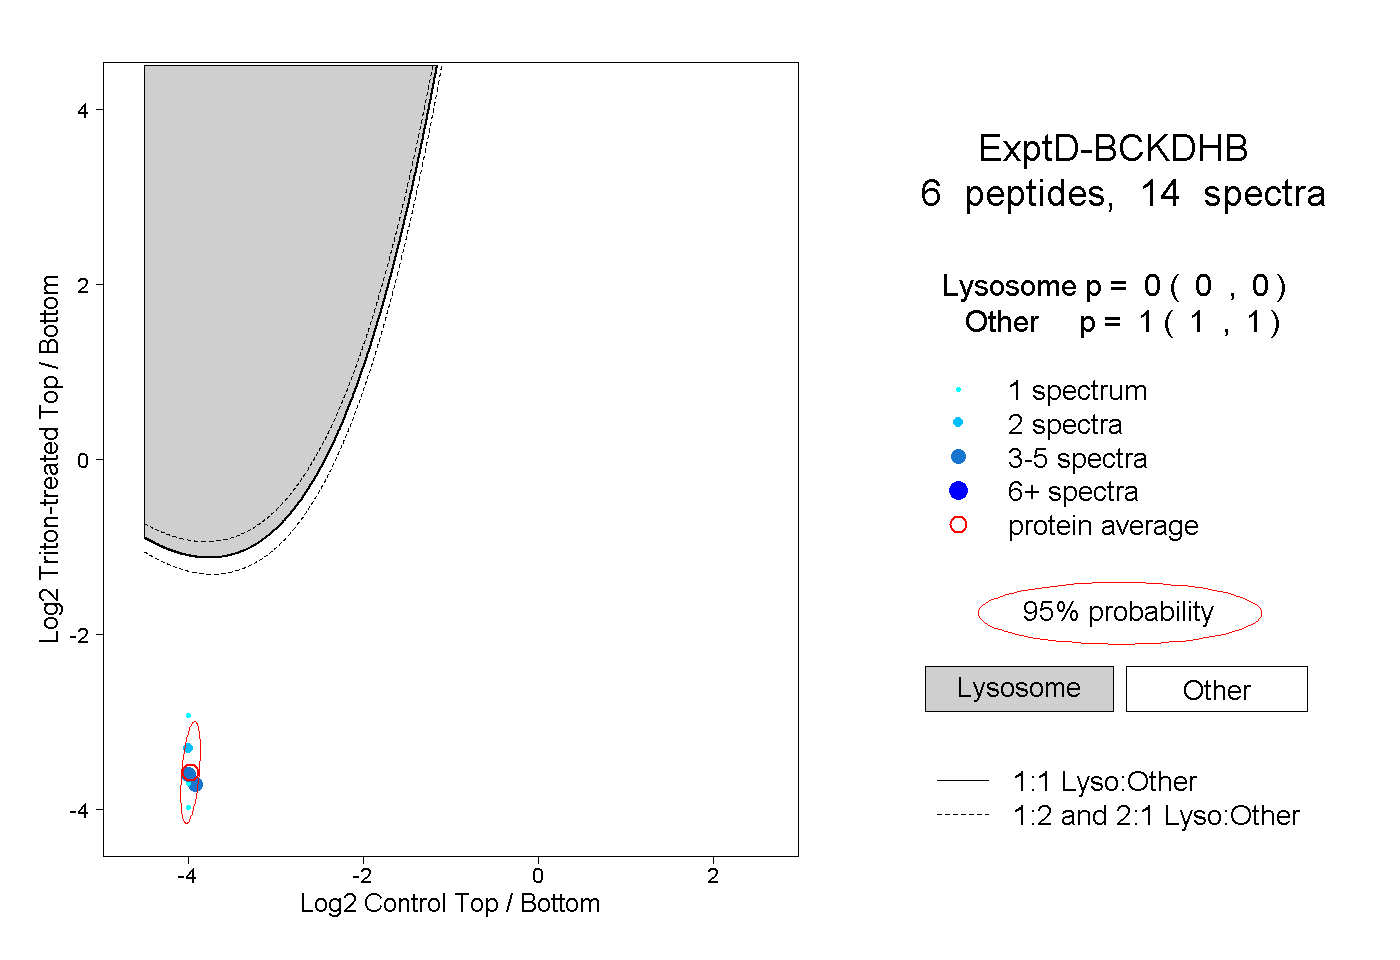 |
0.000 0.000 | 0.000 |
1.000 1.000 | 1.000 |