 14
14peptides
spectra
0.000 | 0.000
0.018 | 0.027
0.000 | 0.000
0.000 | 0.000
0.000 | 0.000
0.000 | 0.000
0.972 | 0.981
0.000 | 0.000
| Plot | Mito | Lyso | Perox | ER | Golgi | PM | Cytosol | Nucleus | |||||
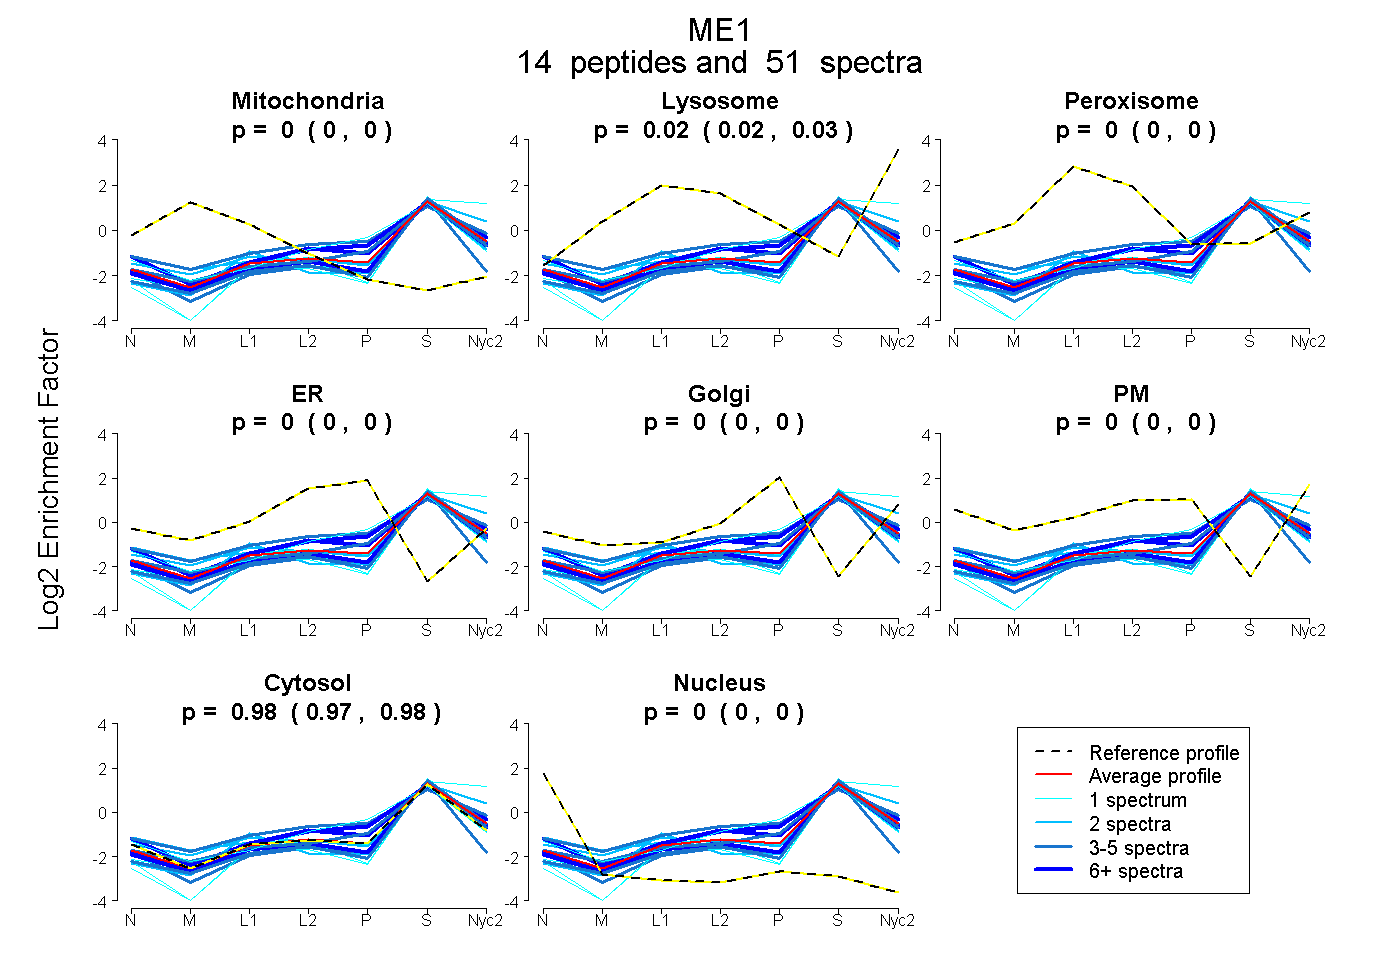
| Expt A |
14 peptides |
51 spectra |
|
0.000 0.000 | 0.000 |
0.023 0.018 | 0.027 |
0.000 0.000 | 0.000 |
0.000 0.000 | 0.000 |
0.000 0.000 | 0.000 |
0.000 0.000 | 0.000 |
0.977 0.972 | 0.981 |
0.000 0.000 | 0.000 |
| 2 spectra, DPLYIGLR | 0.000 | 0.140 | 0.000 | 0.000 | 0.000 | 0.000 | 0.860 | 0.000 | ||
| 2 spectra, GLFISIHDK | 0.000 | 0.000 | 0.000 | 0.000 | 0.000 | 0.000 | 1.000 | 0.000 | ||
| 6 spectra, IWLVDSK | 0.000 | 0.008 | 0.000 | 0.049 | 0.025 | 0.000 | 0.918 | 0.000 | ||
| 1 spectrum, NLEAIVQK | 0.000 | 0.000 | 0.000 | 0.053 | 0.091 | 0.000 | 0.857 | 0.000 | ||
| 1 spectrum, GPEYDAFLDEFMEAASSK | 0.000 | 0.000 | 0.000 | 0.000 | 0.000 | 0.000 | 1.000 | 0.000 | ||
| 2 spectra, AIVVTDGER | 0.105 | 0.000 | 0.004 | 0.000 | 0.000 | 0.000 | 0.892 | 0.000 | ||
| 5 spectra, LYPPLNTIR | 0.000 | 0.000 | 0.000 | 0.000 | 0.055 | 0.000 | 0.945 | 0.000 | ||
| 3 spectra, AECSAEECYK | 0.000 | 0.000 | 0.000 | 0.000 | 0.000 | 0.000 | 0.925 | 0.075 | ||
| 11 spectra, LNSDFDR | 0.000 | 0.000 | 0.000 | 0.000 | 0.000 | 0.000 | 1.000 | 0.000 | ||
| 1 spectrum, DMAAFNERPIIFALSNPTSK | 0.000 | 0.000 | 0.000 | 0.000 | 0.000 | 0.000 | 1.000 | 0.000 | ||
| 1 spectrum, IVQDAYK | 0.000 | 0.155 | 0.000 | 0.000 | 0.000 | 0.000 | 0.845 | 0.000 | ||
| 4 spectra, HLEEGR | 0.000 | 0.109 | 0.029 | 0.000 | 0.099 | 0.000 | 0.763 | 0.000 | ||
| 9 spectra, EVFAHEHEEMK | 0.000 | 0.039 | 0.000 | 0.000 | 0.000 | 0.063 | 0.899 | 0.000 | ||
| 3 spectra, YLLLMDLQDR | 0.000 | 0.000 | 0.000 | 0.000 | 0.000 | 0.000 | 1.000 | 0.000 |
| Plot | Mito | Lyso or Perox | ER | Golgi | PM | Cytosol | Nucleus | ||||||
| Expt B |
1 peptide |
4 spectra |
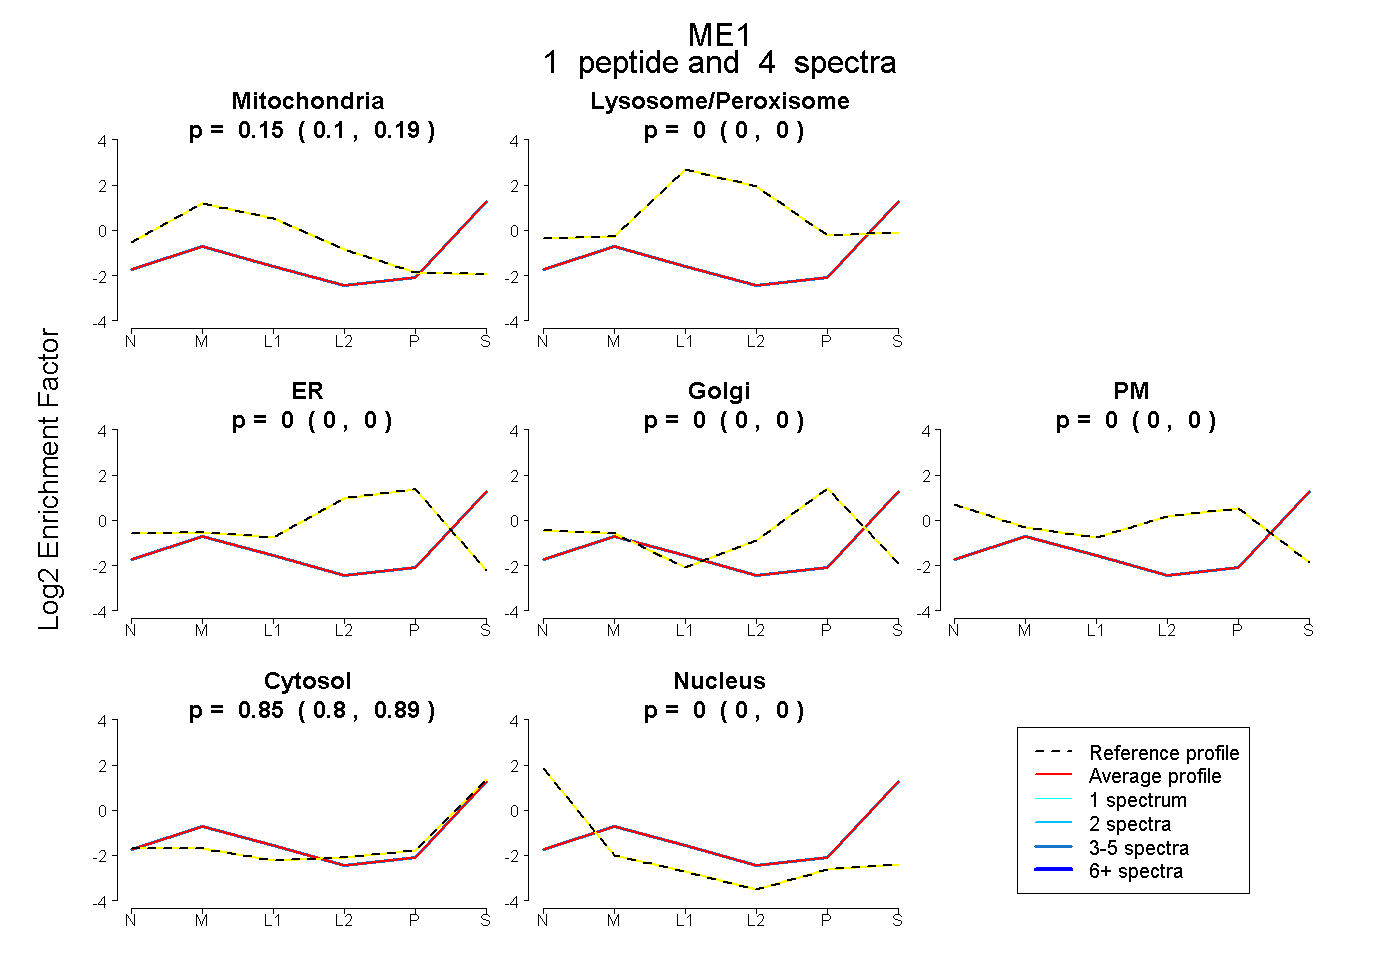 |
0.148 0.099 | 0.186 |
0.000 0.000 | 0.000 |
0.000 0.000 | 0.000 |
0.000 0.000 | 0.000 |
0.000 0.000 | 0.000 |
0.852 0.805 | 0.893 |
0.000 0.000 | 0.000 |
|||
| Plot | Lyso | Other | |||||||||||
| Expt C |
11 peptides |
27 spectra |
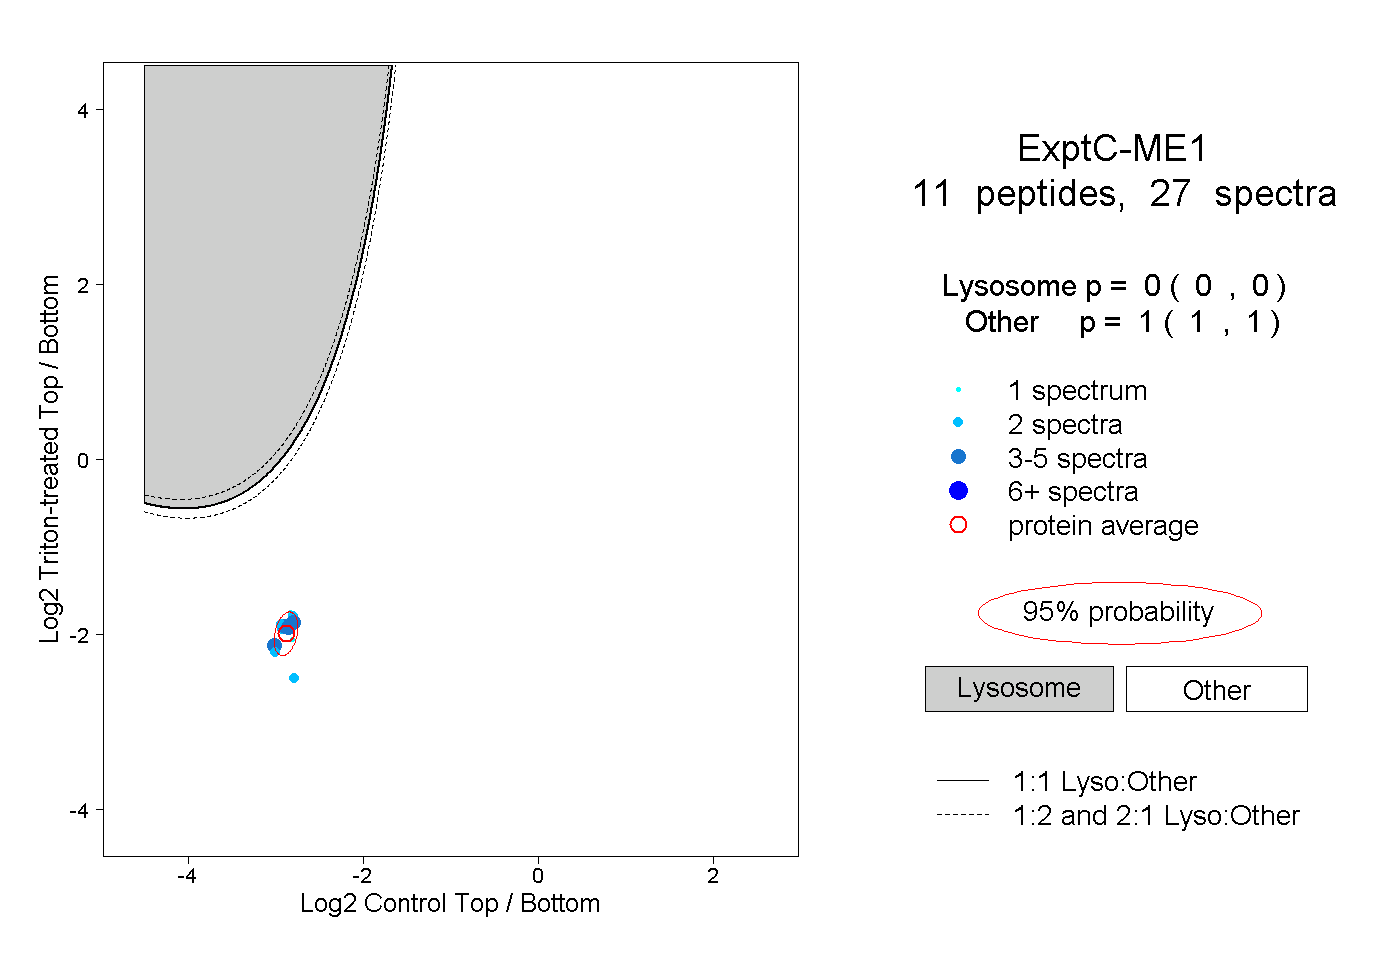 |
0.000 0.000 | 0.000 |
1.000 1.000 | 1.000 |
||||||||
| Plot | Lyso | Other | |||||||||||
| Expt D |
1 peptide |
1 spectrum |
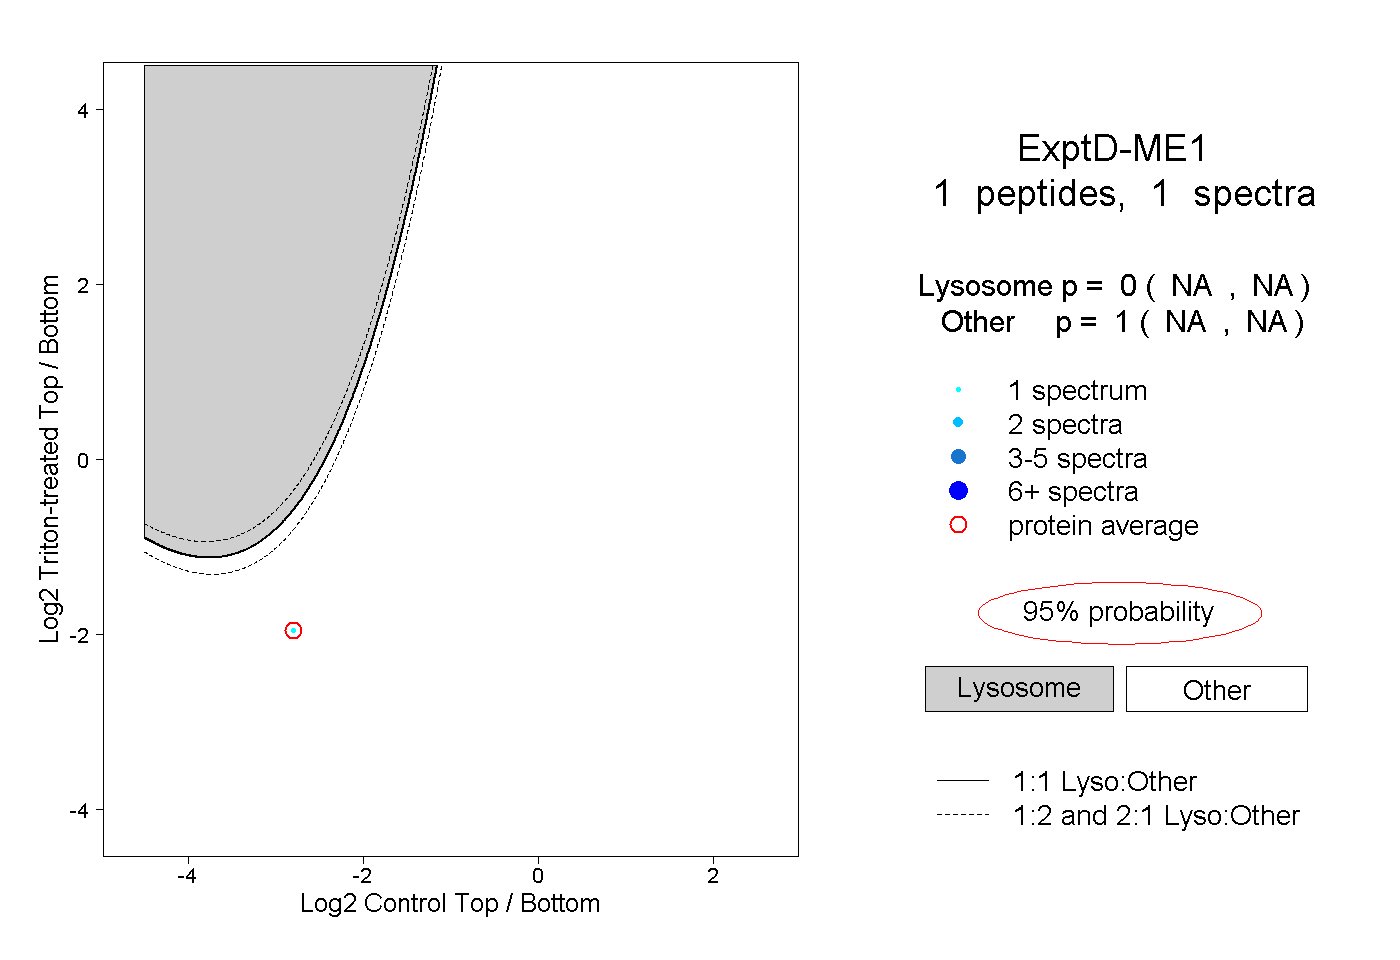 |
0.000 NA | NA |
1.000 NA | NA |