 4
4peptides
spectra
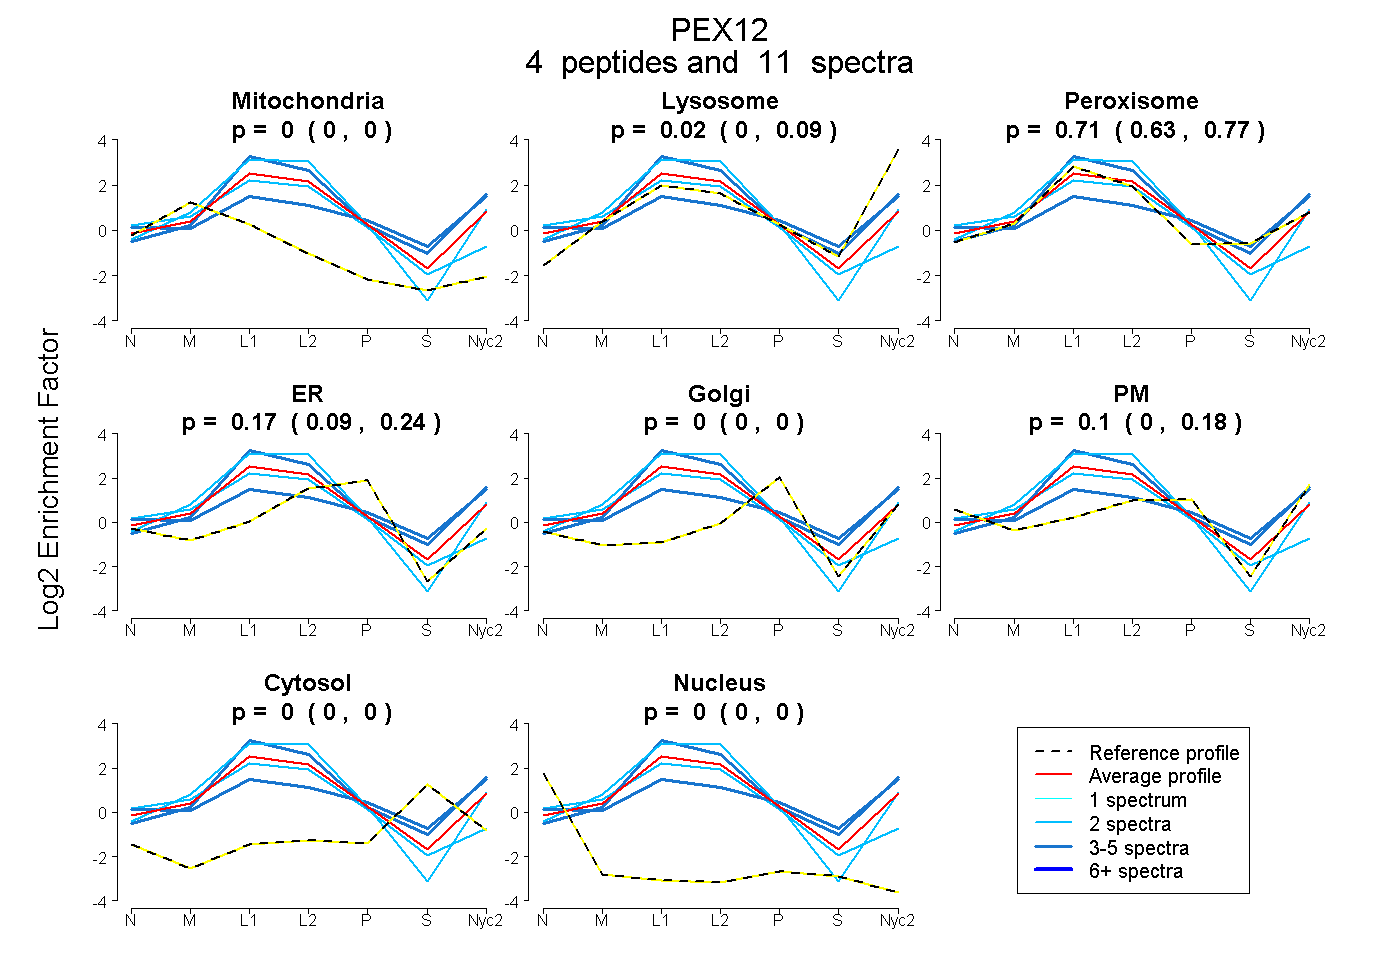
0.000 | 0.000
0.000 | 0.086
0.628 | 0.766
0.090 | 0.243
0.000 | 0.000
0.000 | 0.183
0.000 | 0.000
0.000 | 0.000
2peptides
spectra
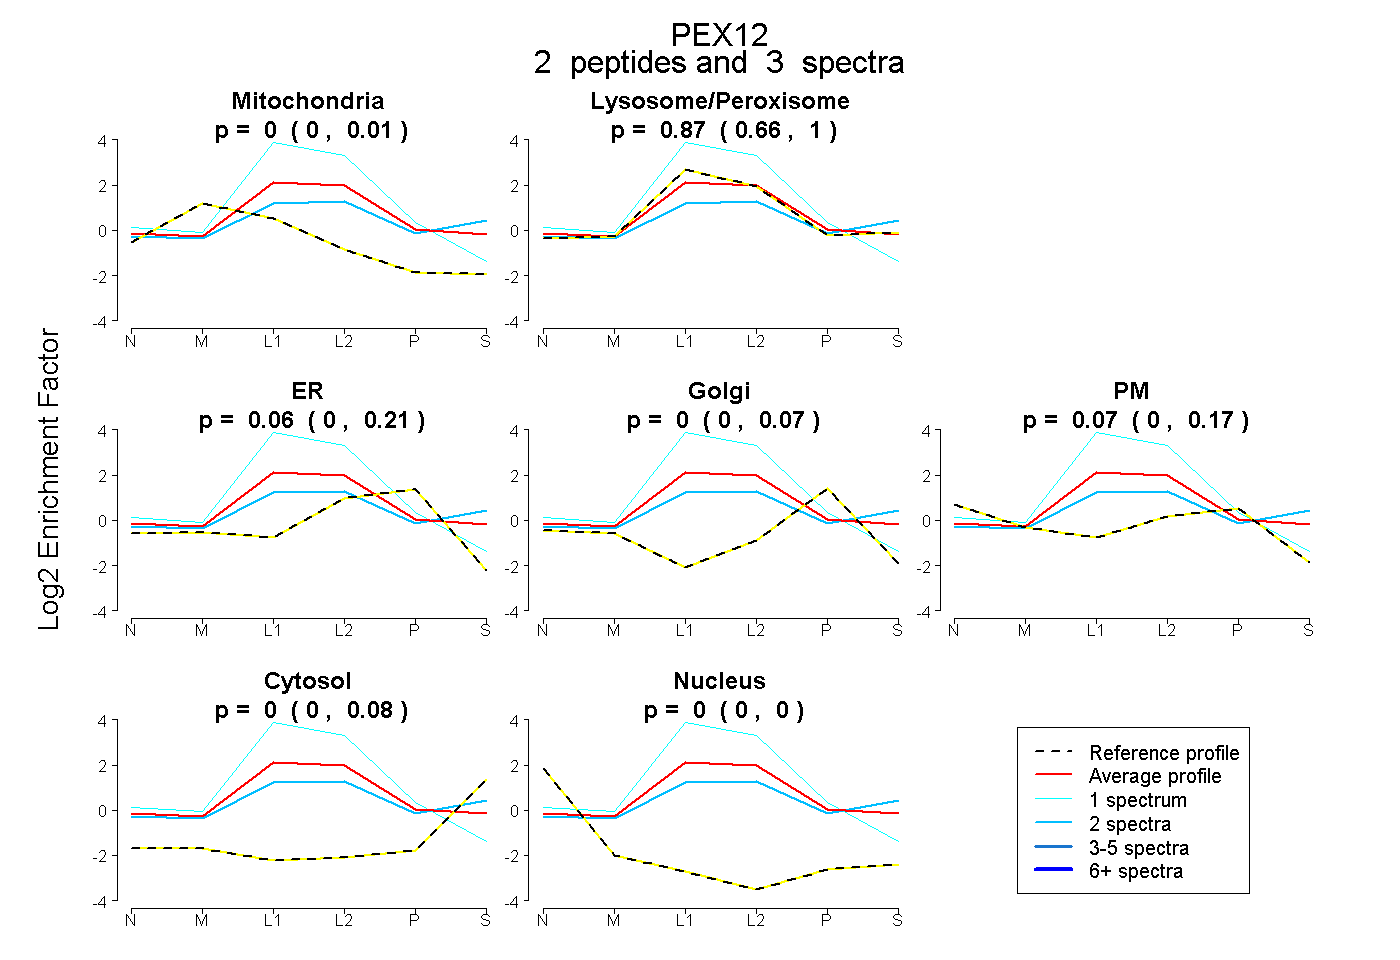
0.000 | 0.014
0.660 | 1.000
0.000 | 0.214
0.000 | 0.072
0.000 | 0.166
0.000 | 0.079
0.000 | 0.003
10peptides
spectra
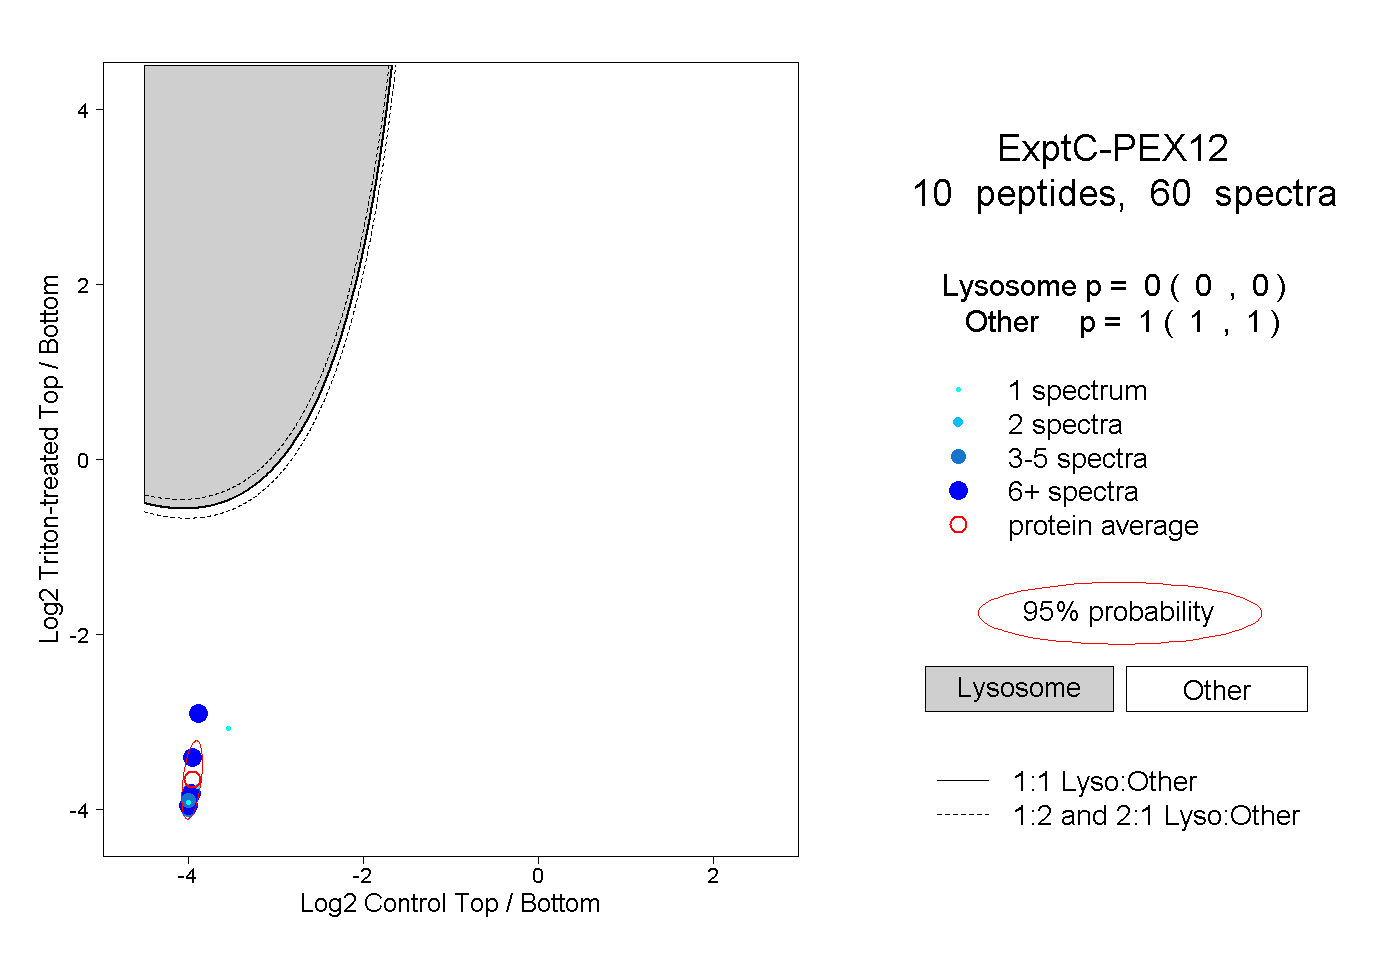
0.000 | 0.000
1.000 | 1.000
4peptides
spectra
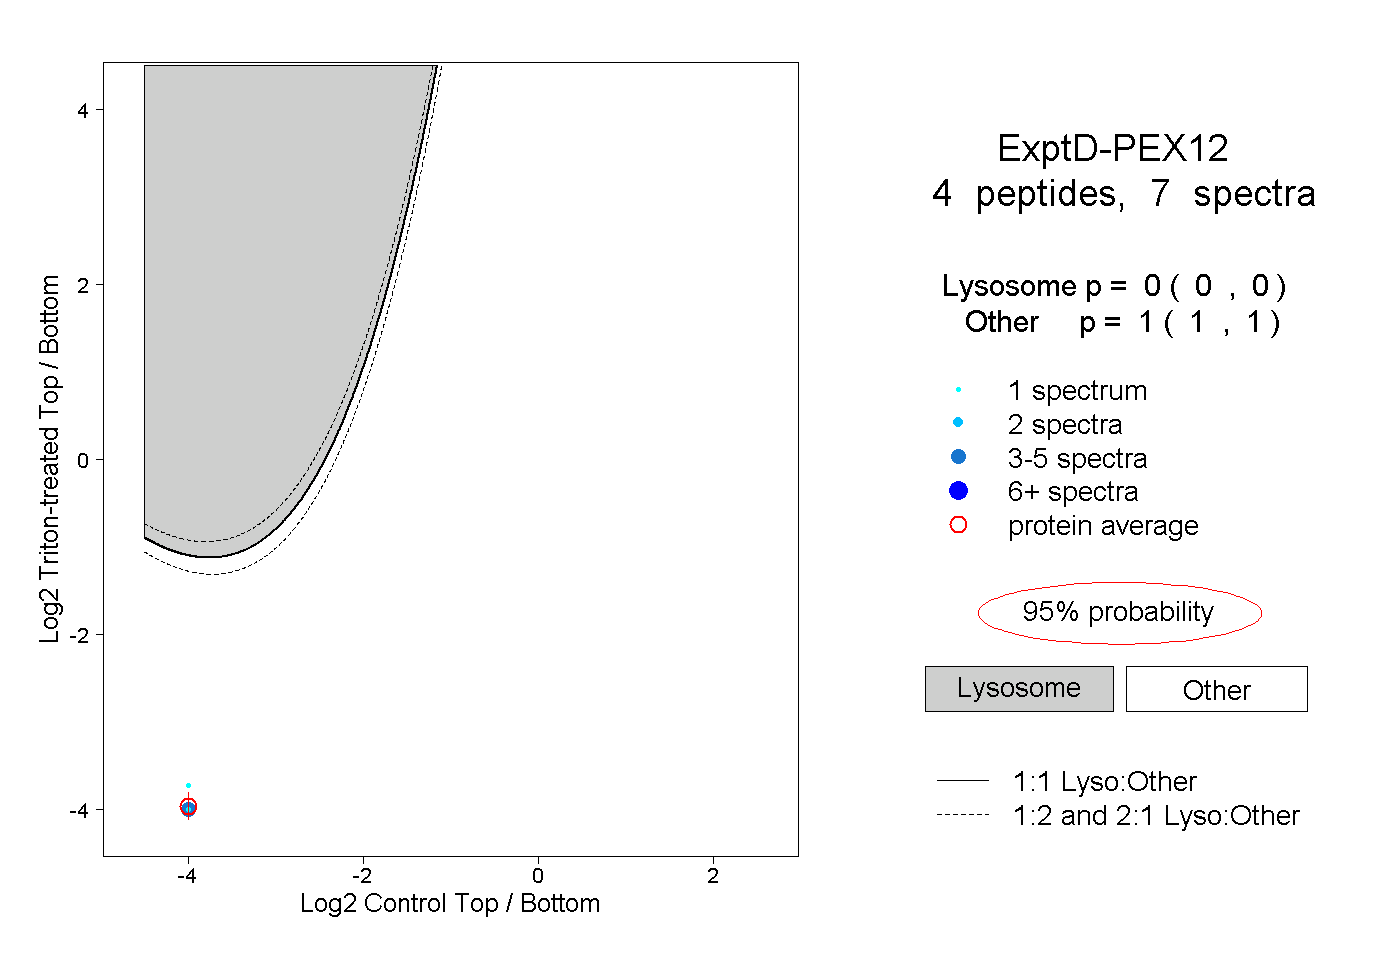
0.000 | 0.000
1.000 | 1.000