 1
1peptide
spectra
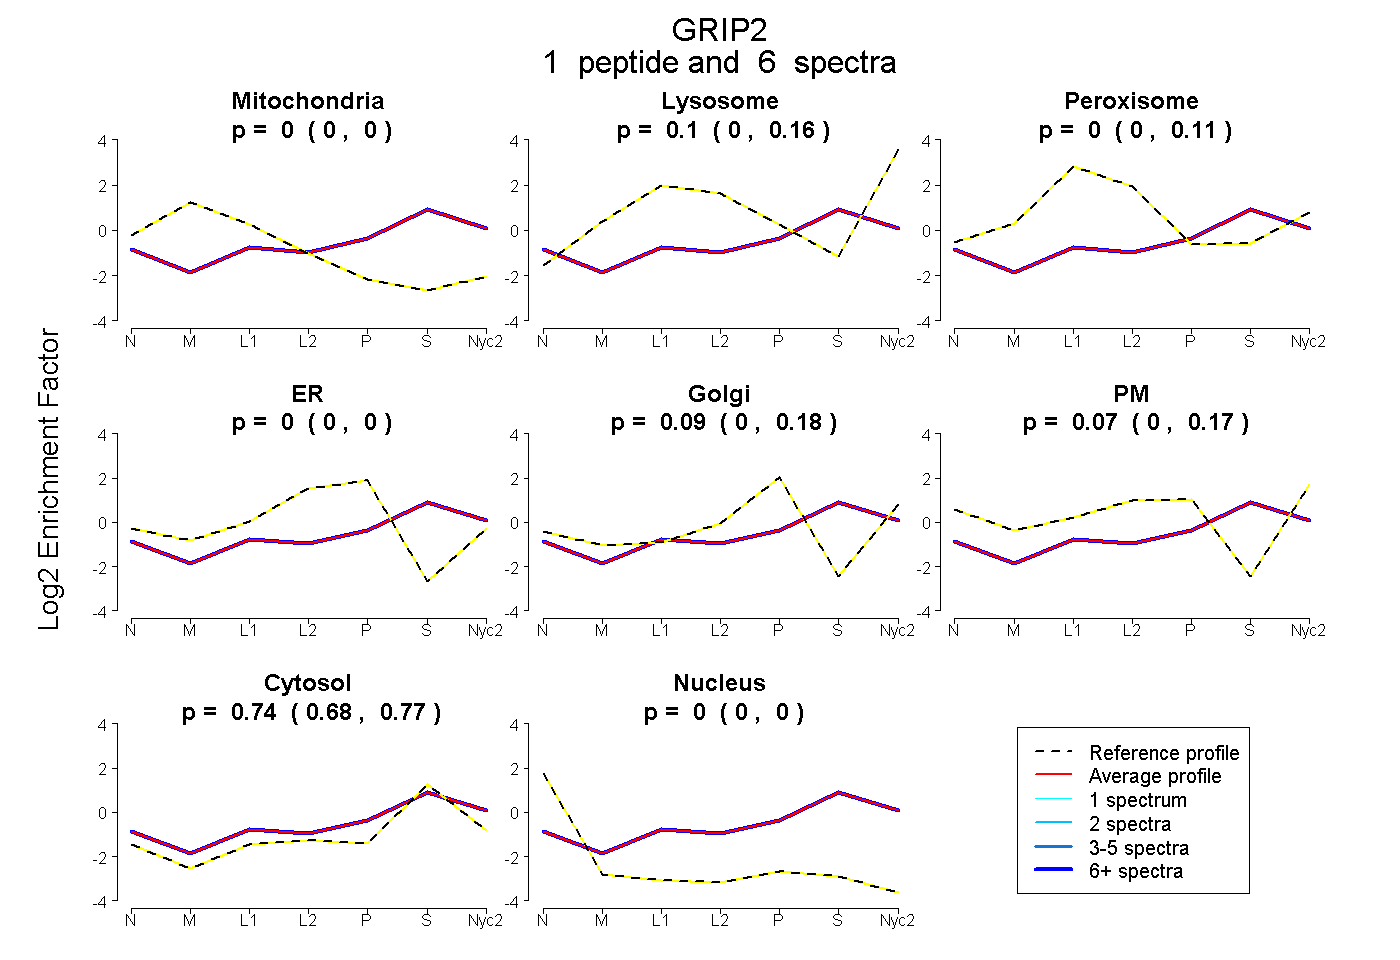
0.000 | 0.000
0.000 | 0.158
0.000 | 0.105
0.000 | 0.000
0.000 | 0.181
0.000 | 0.172
0.680 | 0.771
0.000 | 0.000
2peptides
spectra
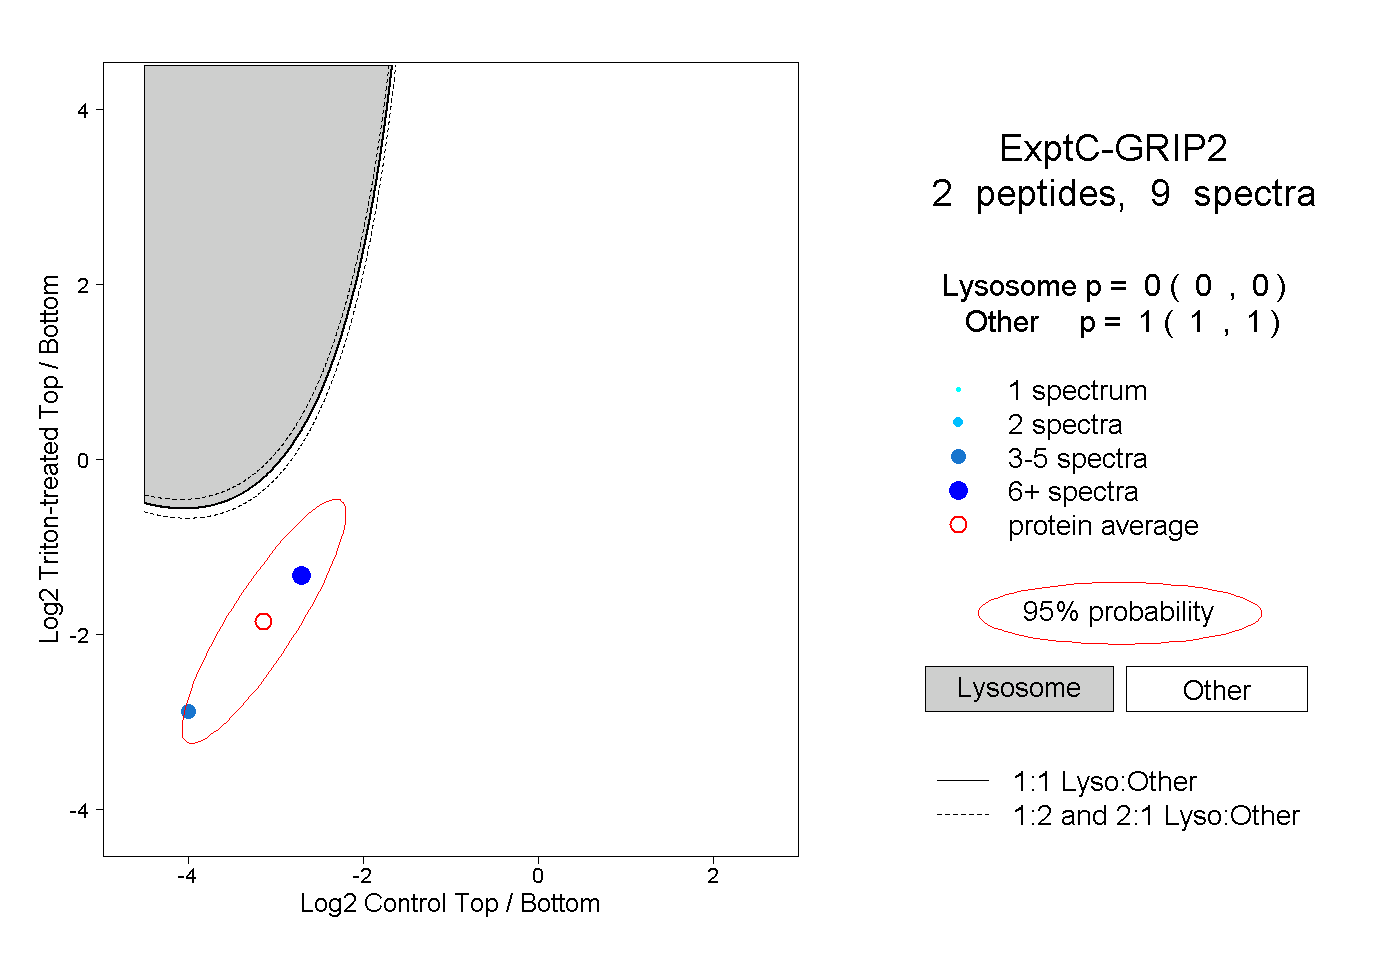
0.000 | 0.000
1.000 | 1.000
| Plot | Mito | Lyso | Perox | ER | Golgi | PM | Cytosol | Nucleus | |||||
| Expt A |
1 peptide |
6 spectra |
|
0.000 0.000 | 0.000 |
0.103 0.000 | 0.158 |
0.000 0.000 | 0.105 |
0.000 0.000 | 0.000 |
0.087 0.000 | 0.181 |
0.072 0.000 | 0.172 |
0.738 0.680 | 0.771 |
0.000 0.000 | 0.000 |
||
| Plot | Lyso | Other | |||||||||||
| Expt C |
2 peptides |
9 spectra |
|
0.000 0.000 | 0.000 |
1.000 1.000 | 1.000 |