5
5peptides
spectra
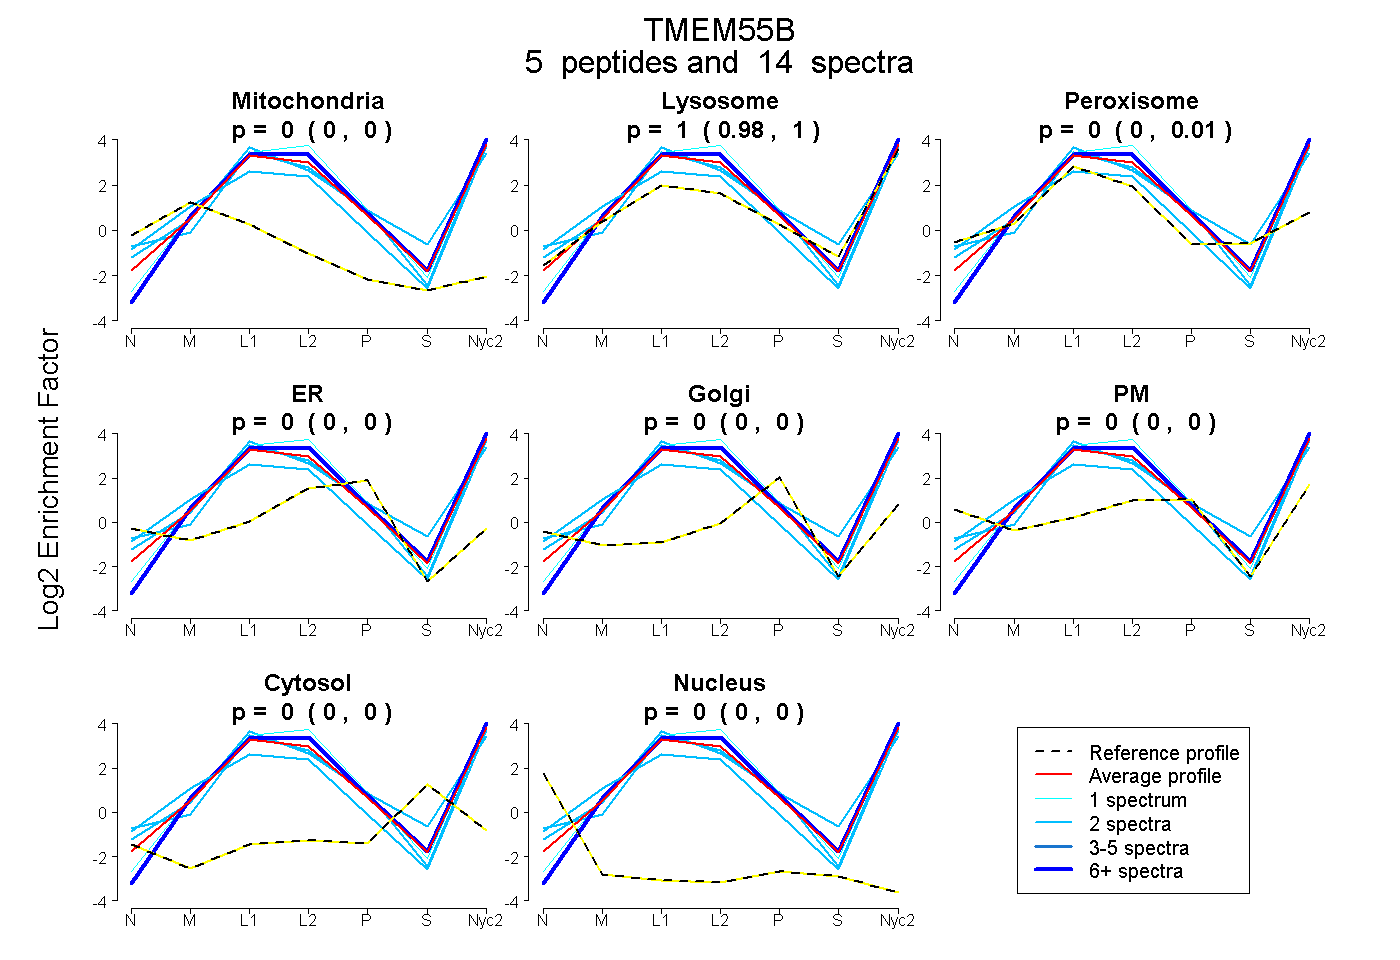
0.000 | 0.000
0.981 | 1.000
0.000 | 0.013
0.000 | 0.000
0.000 | 0.000
0.000 | 0.000
0.000 | 0.000
0.000 | 0.000
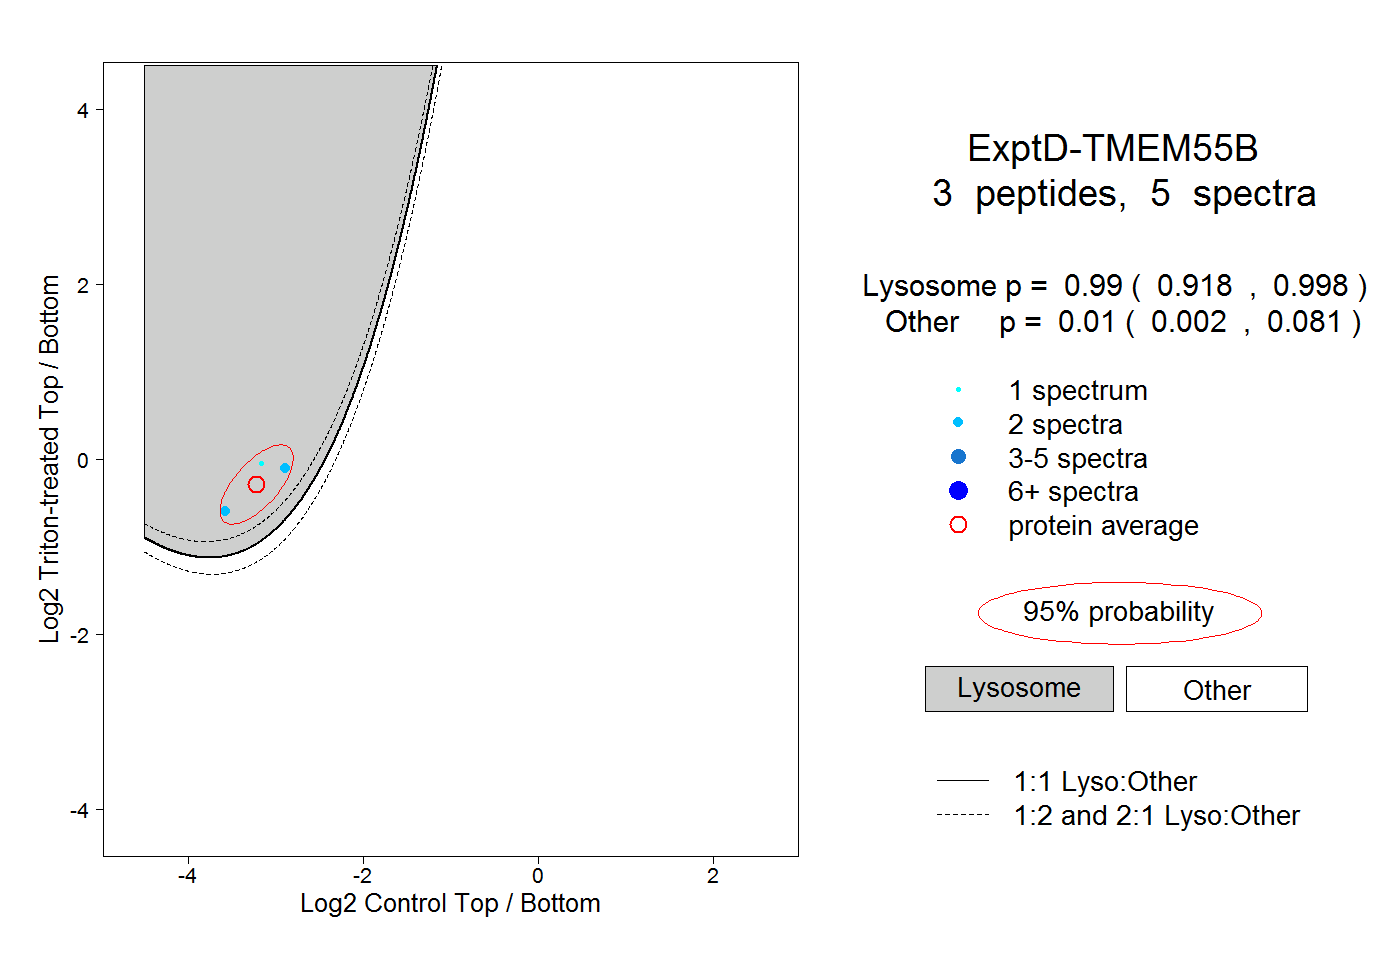
3peptides
spectra
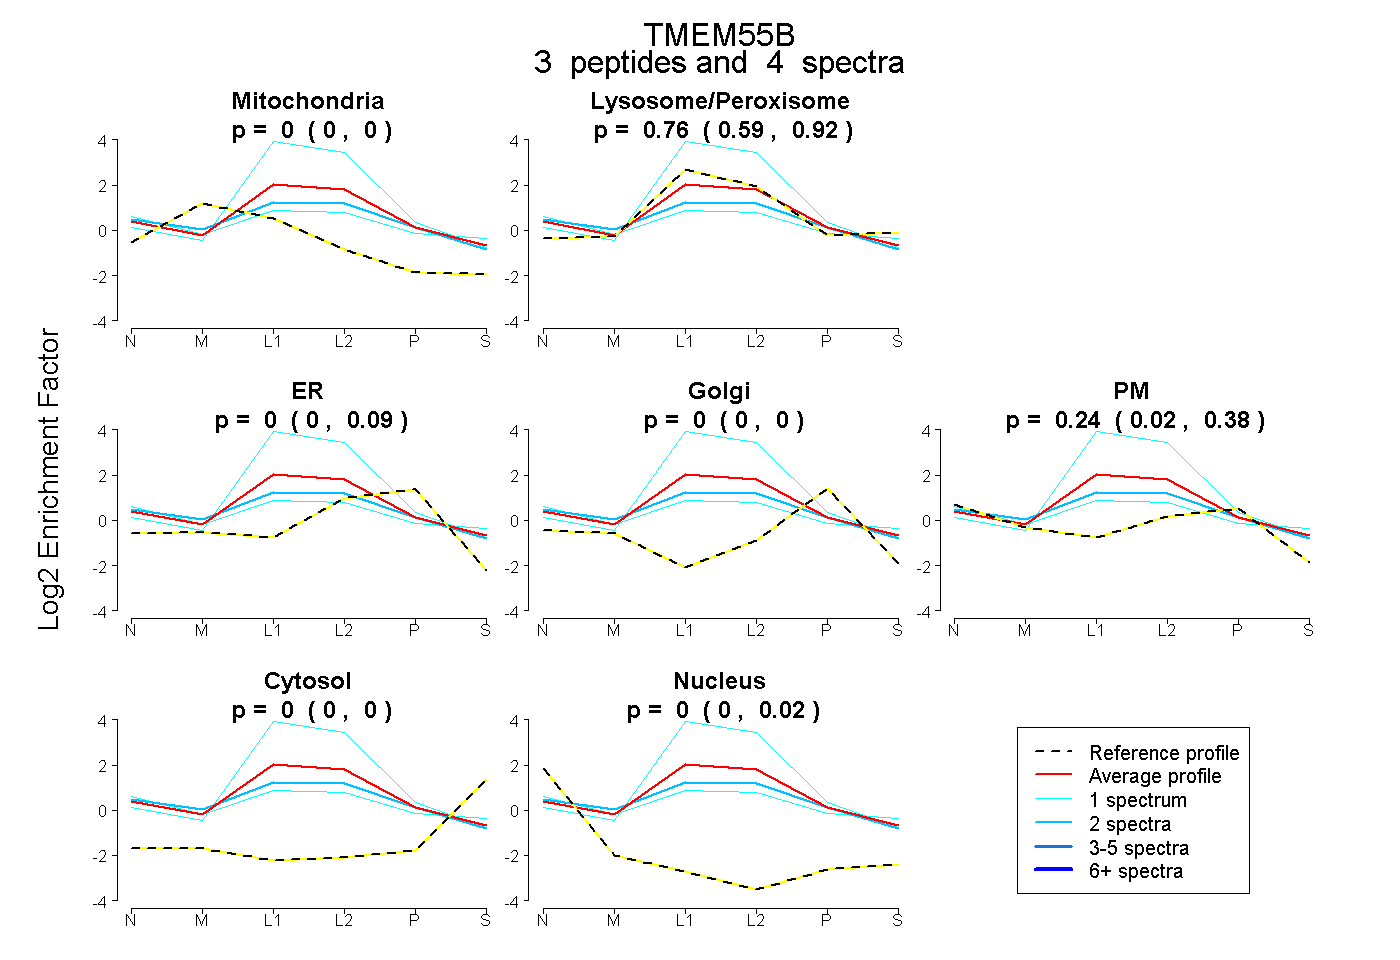
0.000 | 0.000
0.588 | 0.916
0.000 | 0.095
0.000 | 0.000
0.019 | 0.376
0.000 | 0.000
0.000 | 0.018
11peptides
spectra
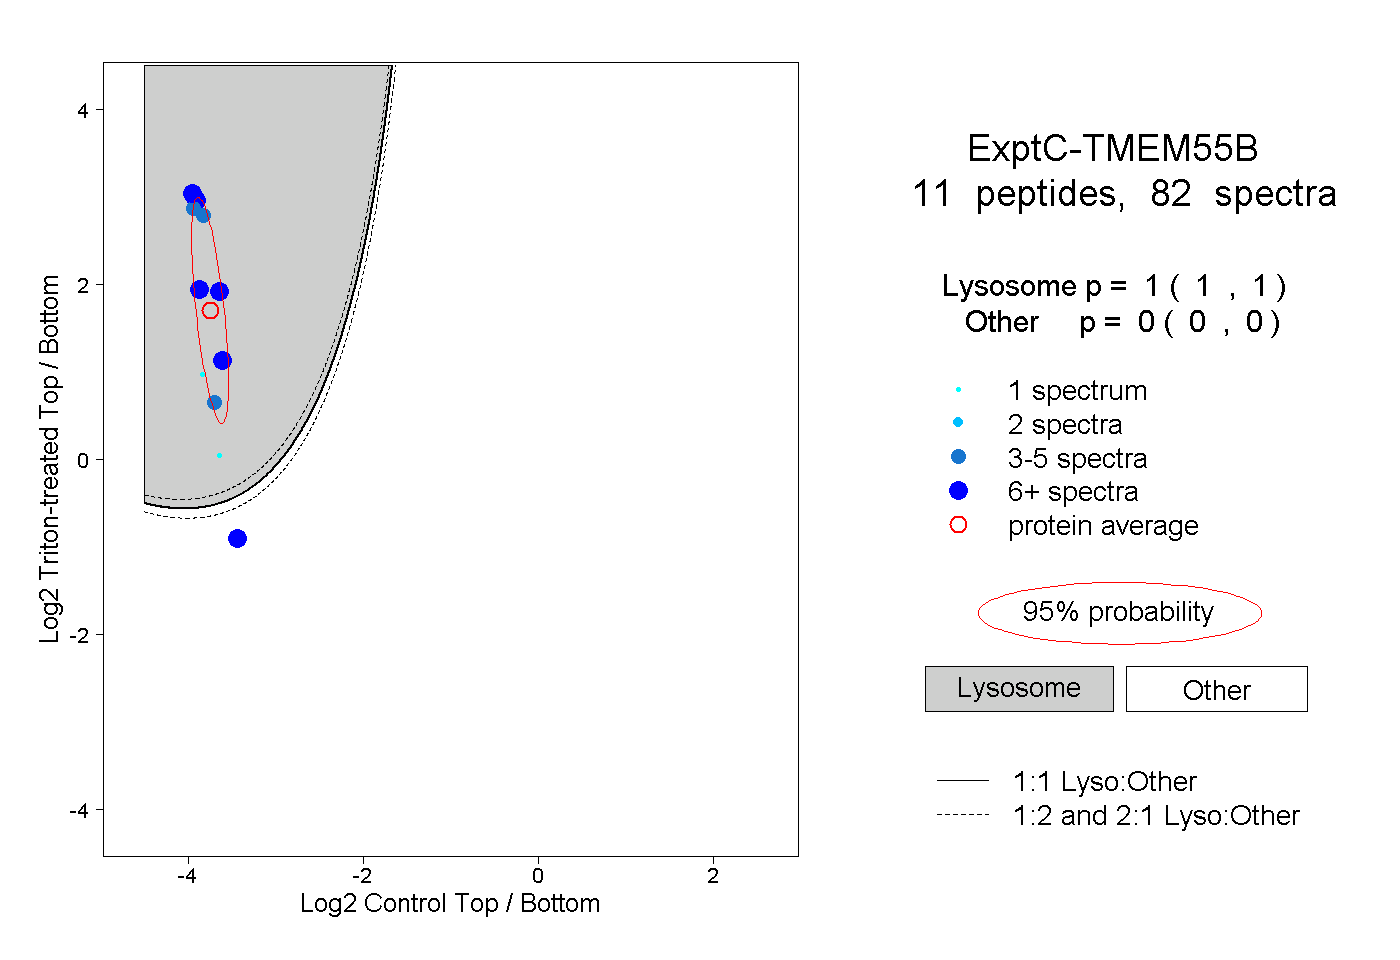
1.000 | 1.000
0.000 | 0.000