 5
5peptides
spectra
0.000 | 0.000
0.981 | 1.000
0.000 | 0.013
0.000 | 0.000
0.000 | 0.000
0.000 | 0.000
0.000 | 0.000
0.000 | 0.000
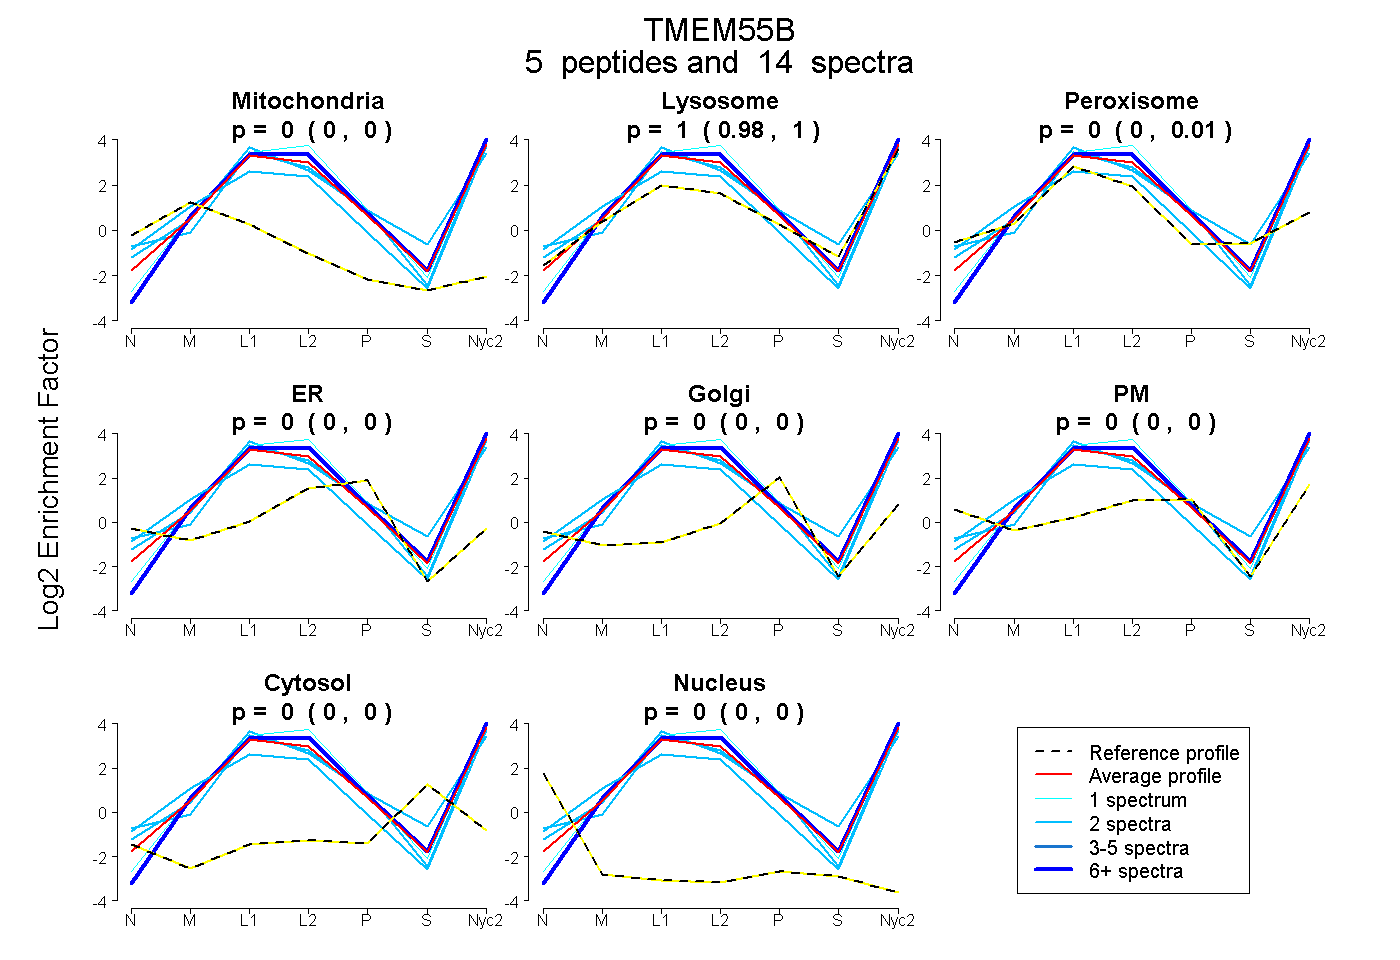
| Plot | Mito | Lyso | Perox | ER | Golgi | PM | Cytosol | Nucleus | |||||
| Expt A |
5 peptides |
14 spectra |
|
0.000 0.000 | 0.000 |
1.000 0.981 | 1.000 |
0.000 0.000 | 0.013 |
0.000 0.000 | 0.000 |
0.000 0.000 | 0.000 |
0.000 0.000 | 0.000 |
0.000 0.000 | 0.000 |
0.000 0.000 | 0.000 |
| 2 spectra, IACPRPYCK | 0.000 | 0.750 | 0.250 | 0.000 | 0.000 | 0.000 | 0.000 | 0.000 | ||
| 7 spectra, NTFLWTEFTDR | 0.000 | 1.000 | 0.000 | 0.000 | 0.000 | 0.000 | 0.000 | 0.000 | ||
| 2 spectra, VCQSPINVEGK | 0.000 | 0.929 | 0.034 | 0.000 | 0.000 | 0.038 | 0.000 | 0.000 | ||
| 1 spectrum, CGVCNEATPIK | 0.000 | 1.000 | 0.000 | 0.000 | 0.000 | 0.000 | 0.000 | 0.000 | ||
| 2 spectra, ALYWGCMK | 0.000 | 1.000 | 0.000 | 0.000 | 0.000 | 0.000 | 0.000 | 0.000 |
| Plot | Mito | Lyso or Perox | ER | Golgi | PM | Cytosol | Nucleus | ||||||
| Expt B |
3 peptides |
4 spectra |
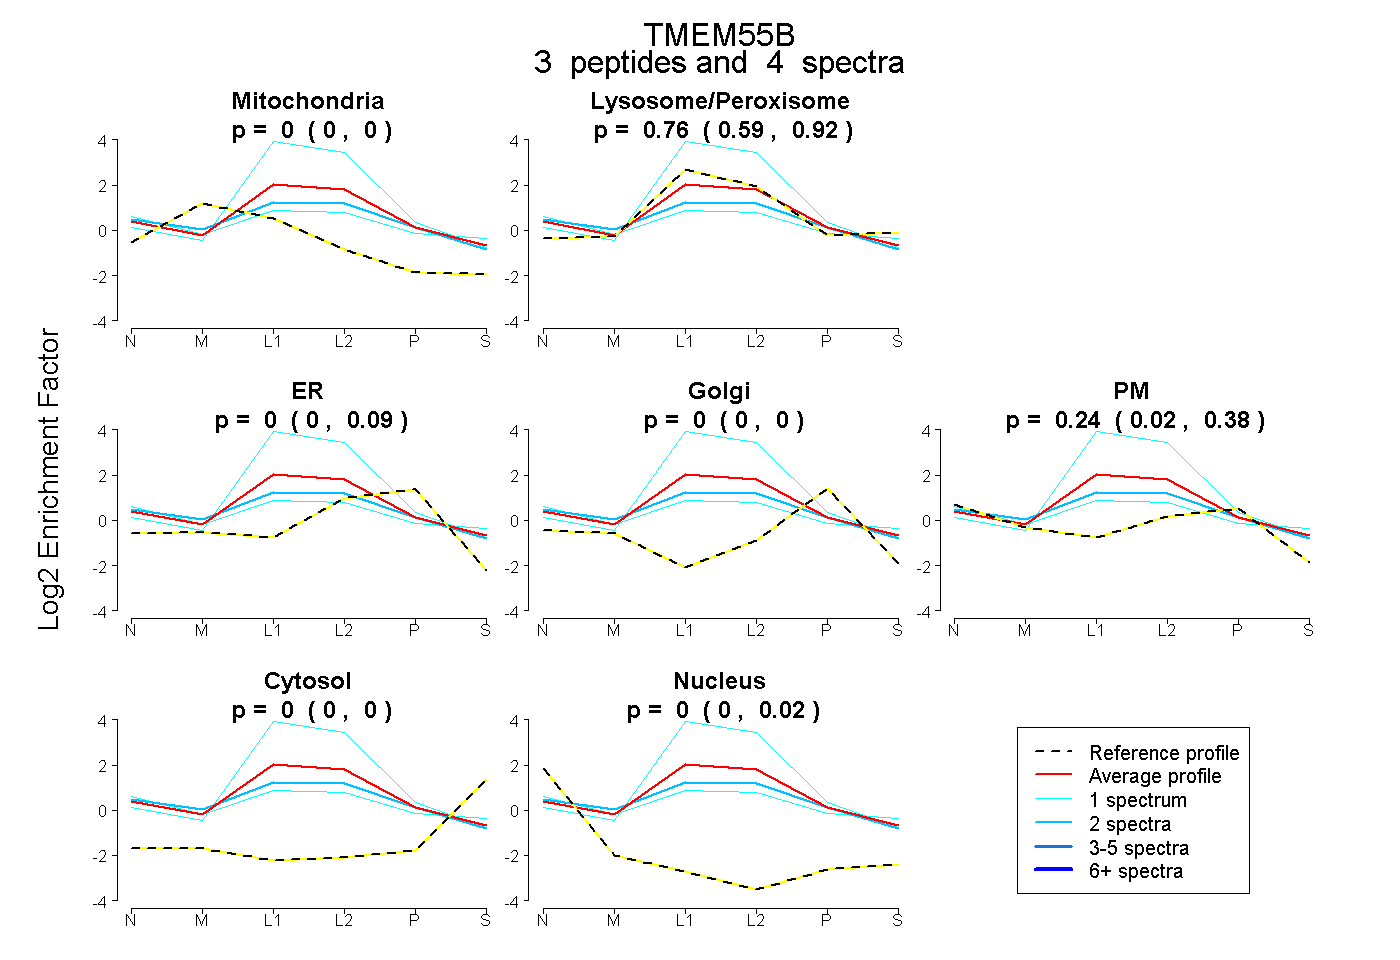 |
0.000 0.000 | 0.000 |
0.765 0.588 | 0.916 |
0.000 0.000 | 0.095 |
0.000 0.000 | 0.000 |
0.235 0.019 | 0.376 |
0.000 0.000 | 0.000 |
0.000 0.000 | 0.018 |
|||
| Plot | Lyso | Other | |||||||||||
| Expt C |
11 peptides |
82 spectra |
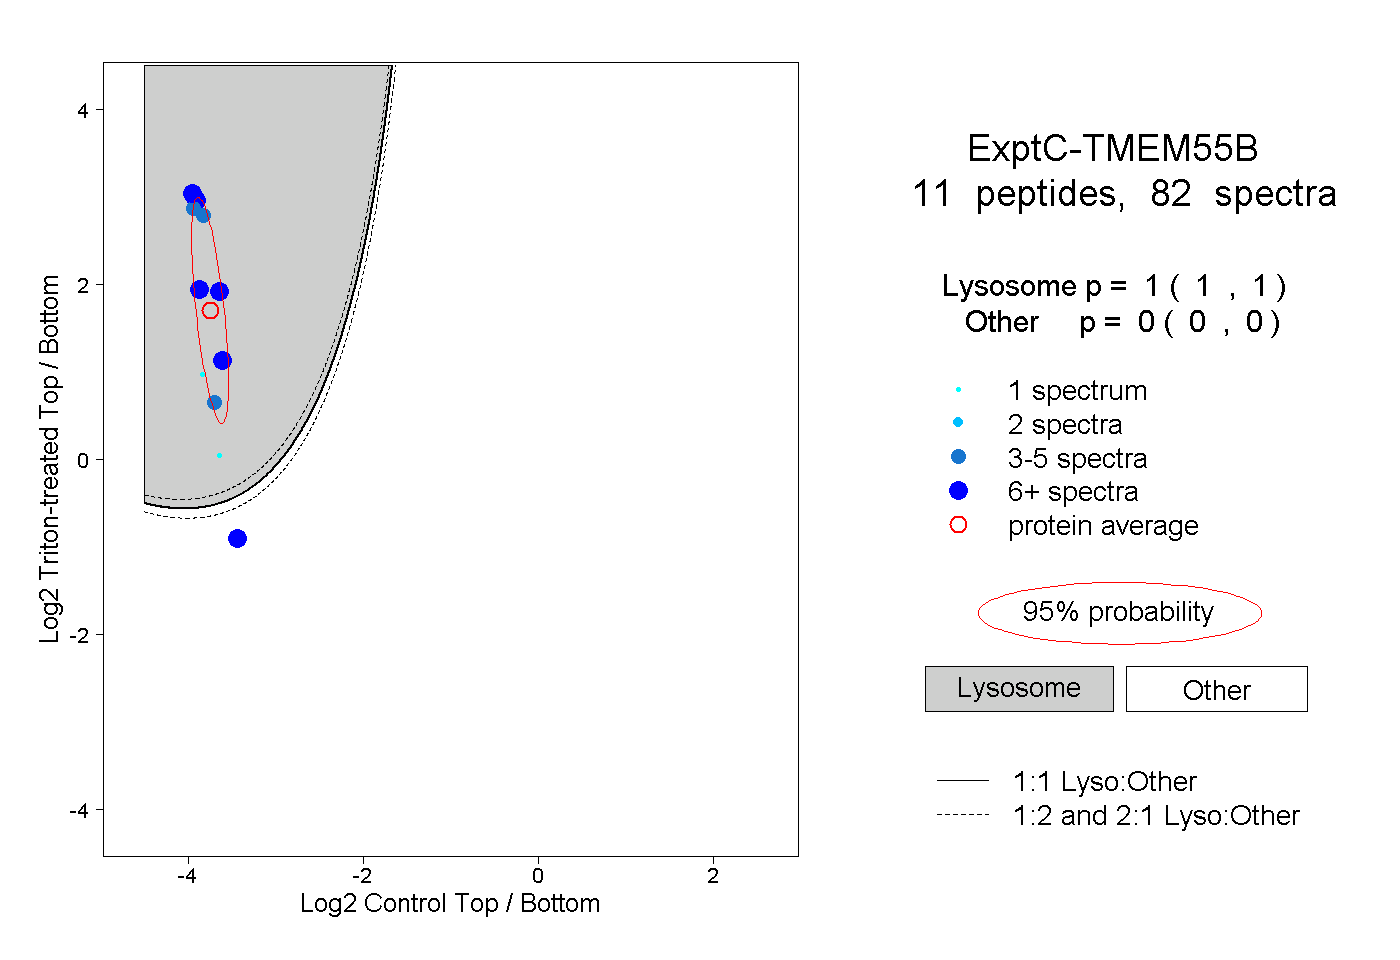 |
1.000 1.000 | 1.000 |
0.000 0.000 | 0.000 |
||||||||
| Plot | Lyso | Other | |||||||||||
| Expt D |
3 peptides |
5 spectra |
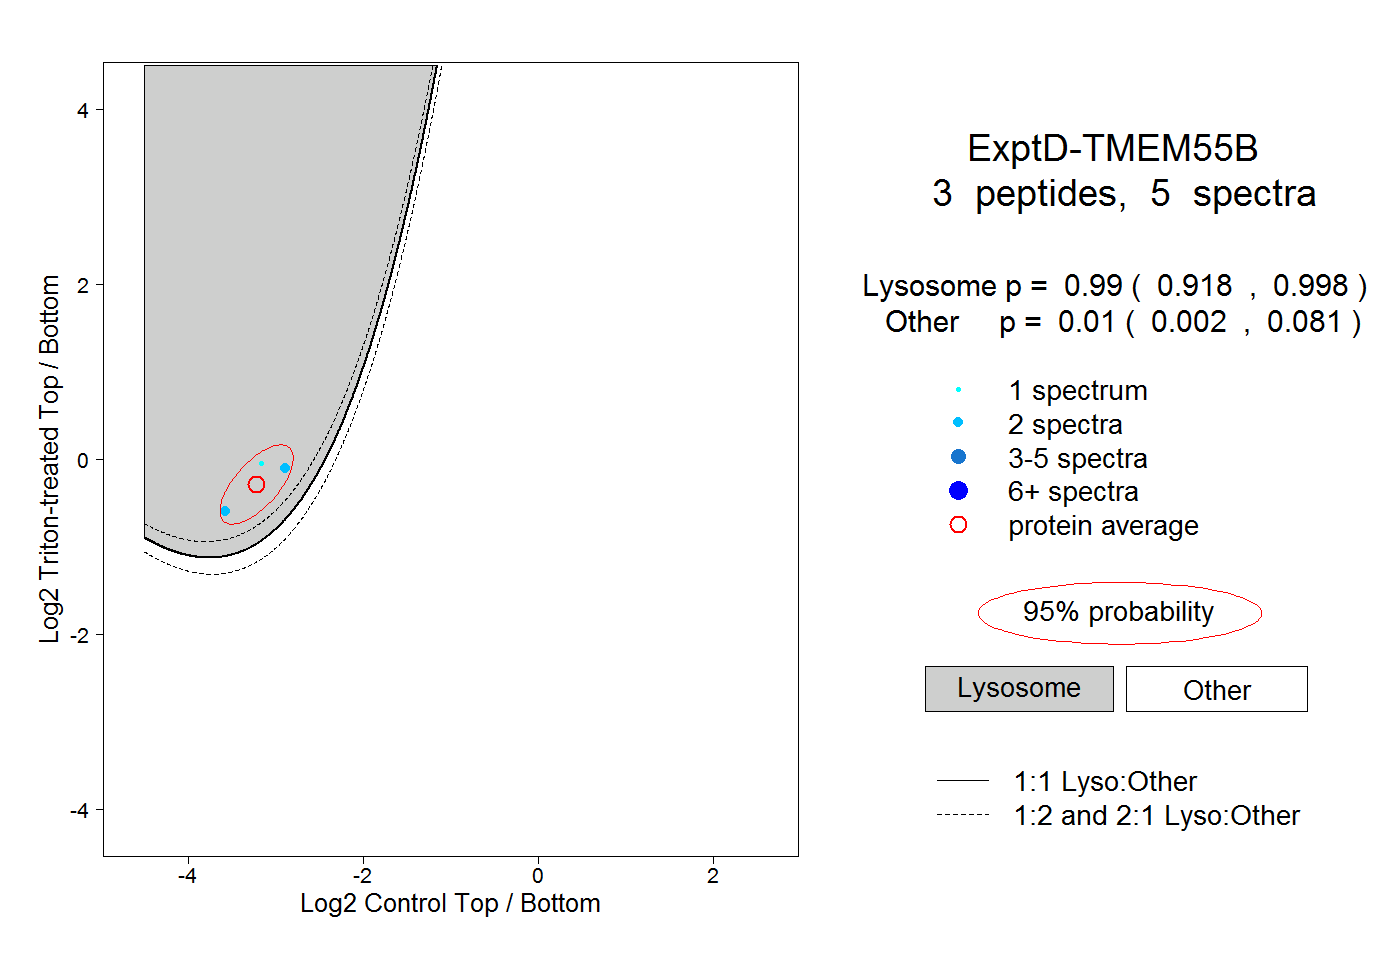 |
0.990 0.918 | 0.998 |
0.010 0.002 | 0.081 |