 4
4peptides
spectra
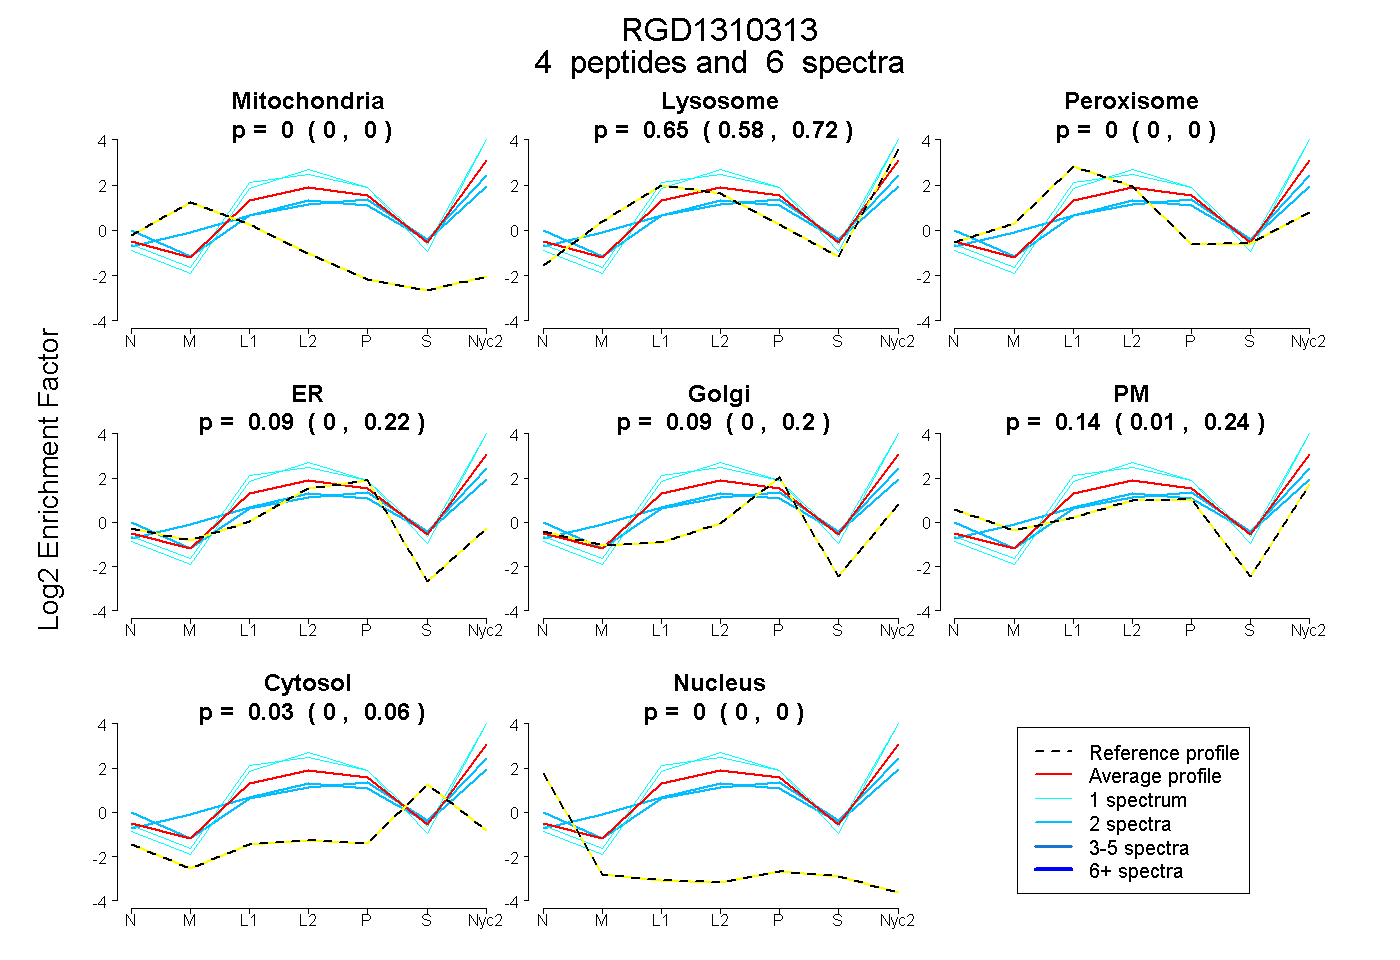
0.000 | 0.000
0.578 | 0.717
0.000 | 0.000
0.000 | 0.218
0.000 | 0.203
0.007 | 0.245
0.000 | 0.063
0.000 | 0.000
1peptide
spectrum
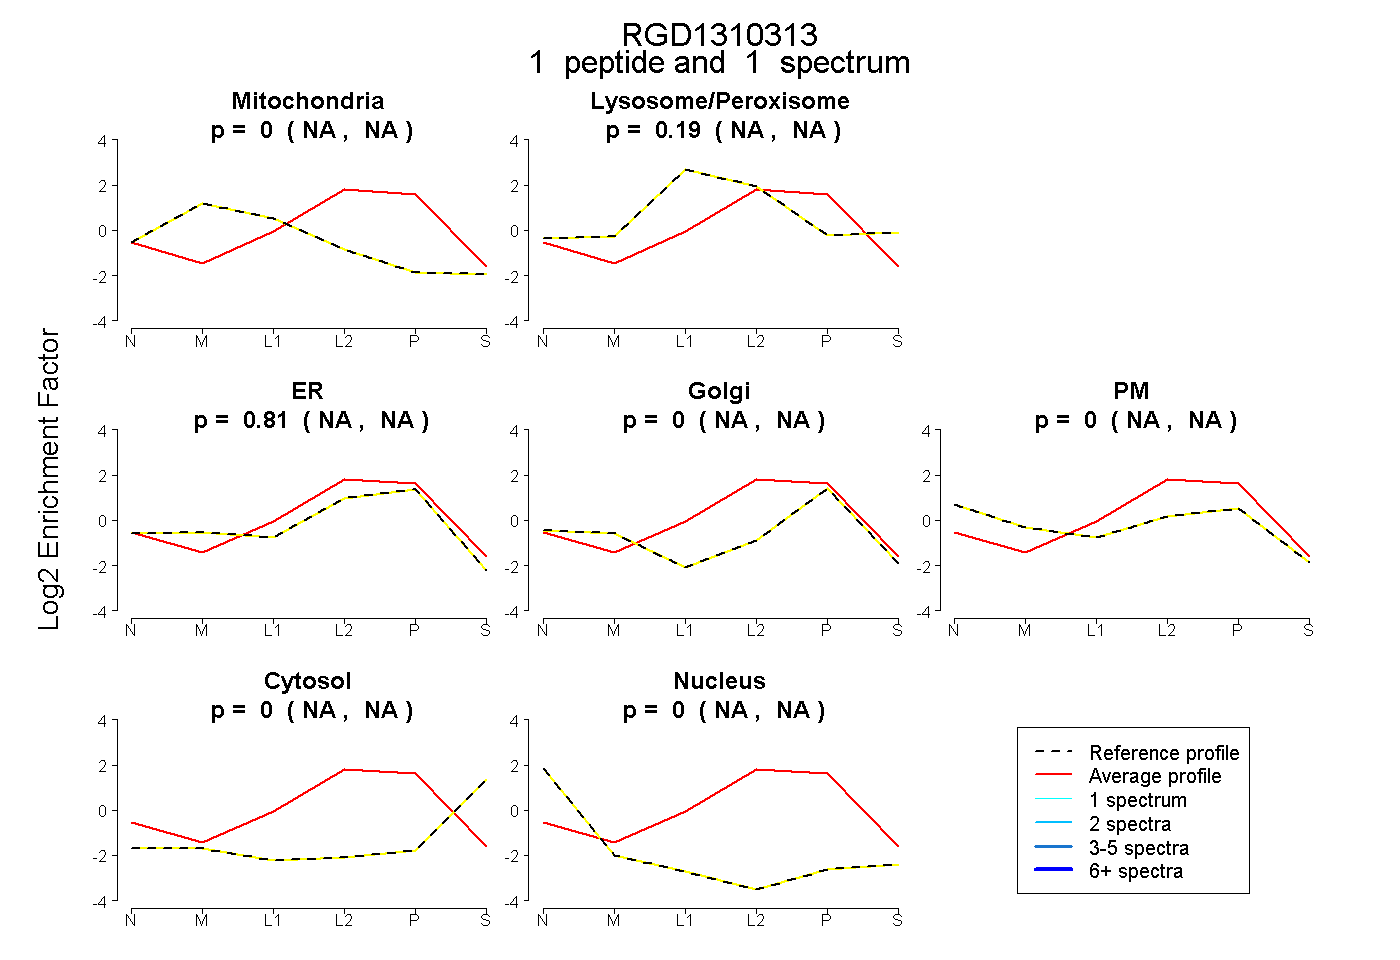
NA | NA
NA | NA
NA | NA
NA | NA
NA | NA
NA | NA
NA | NA
7peptides
spectra
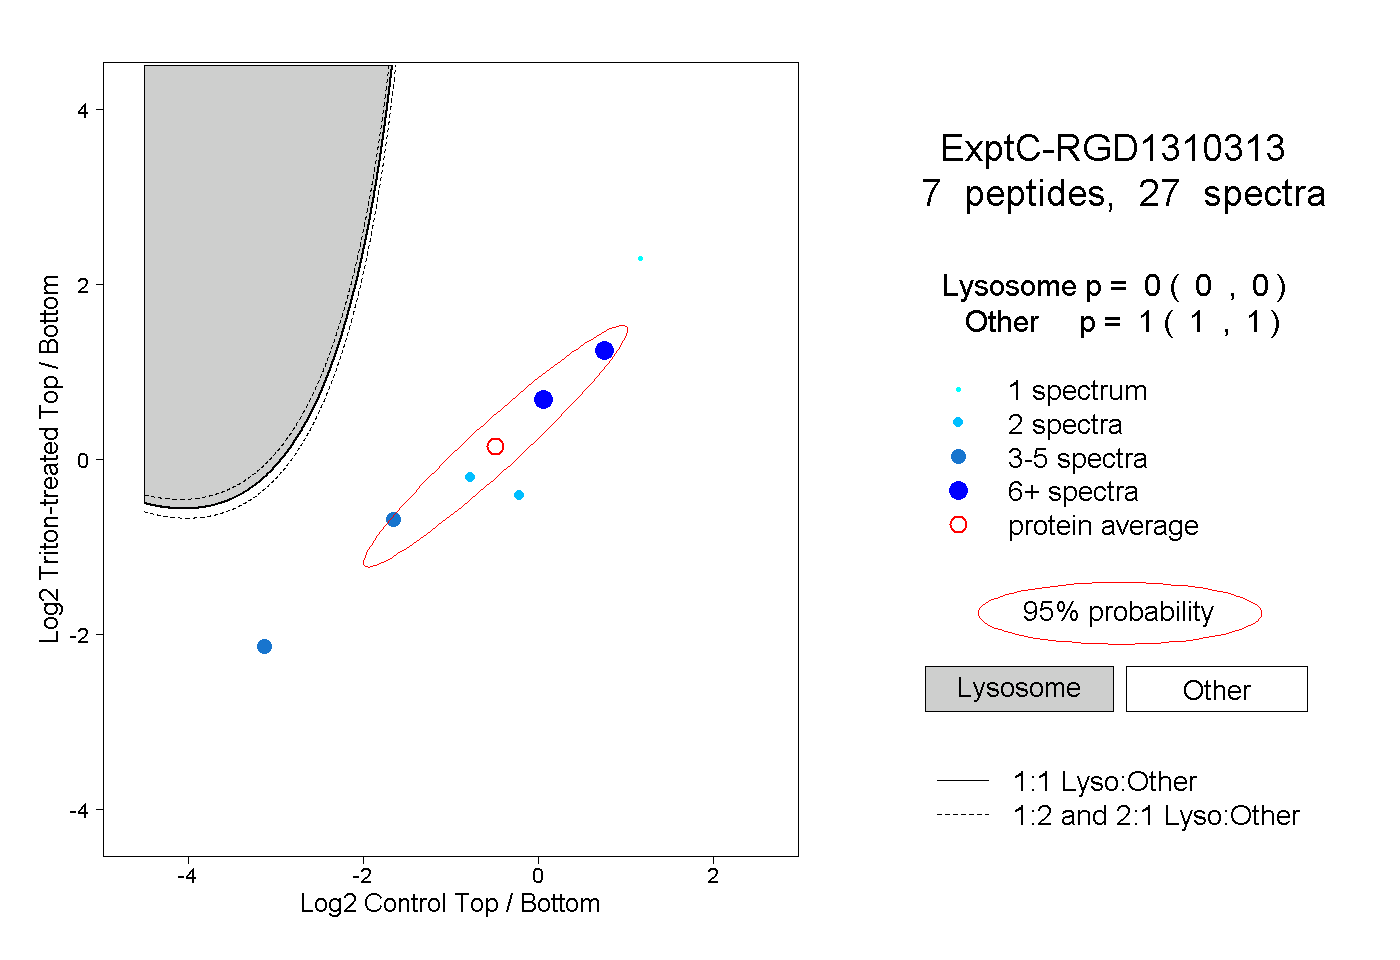
0.000 | 0.000
1.000 | 1.000
2peptides
spectra
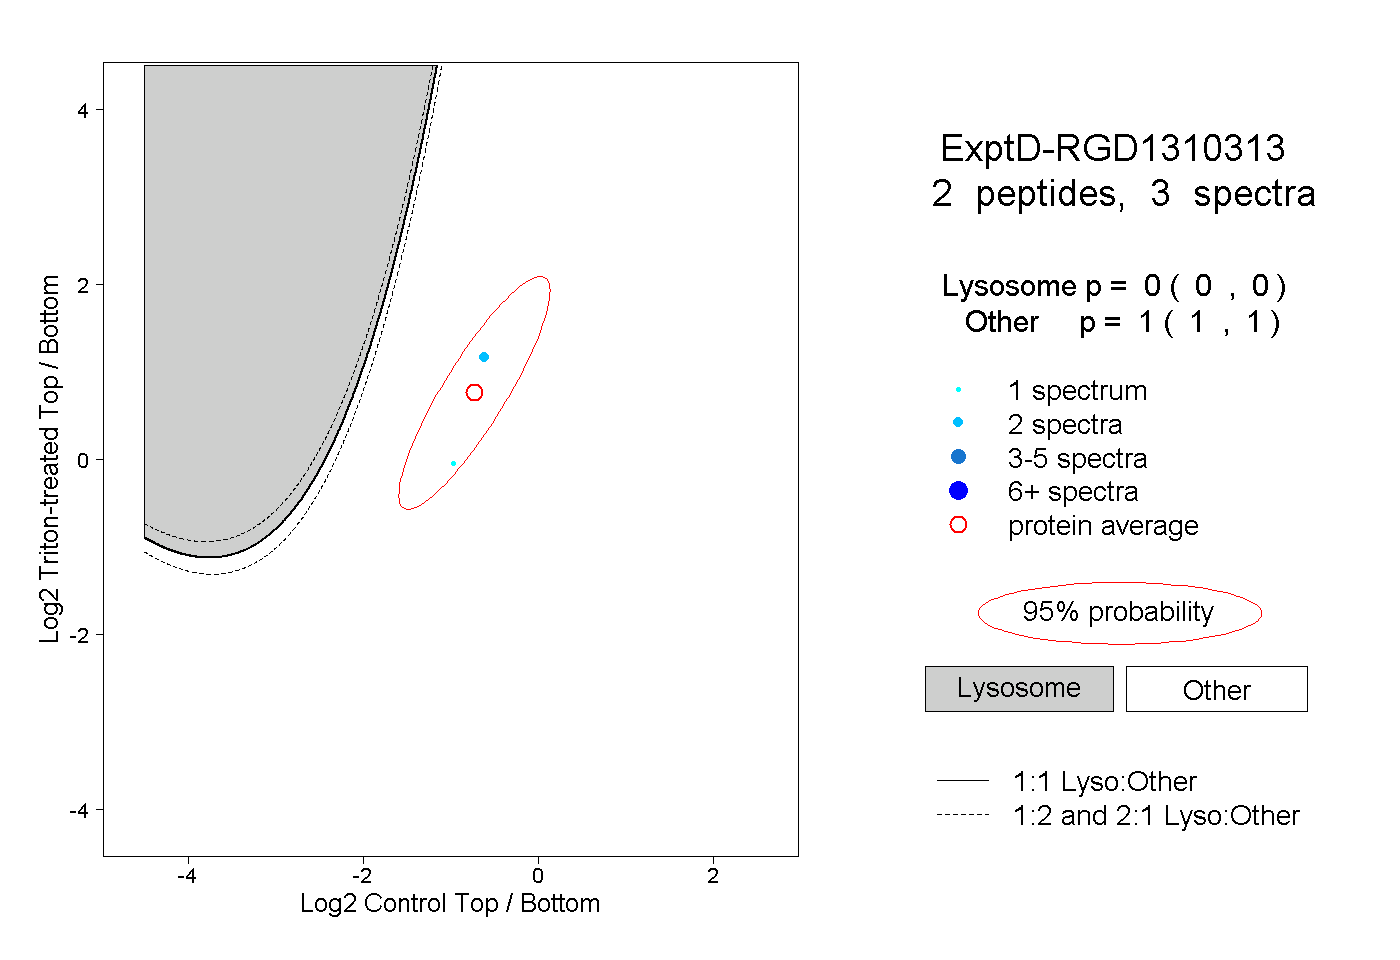
0.000 | 0.000
1.000 | 1.000