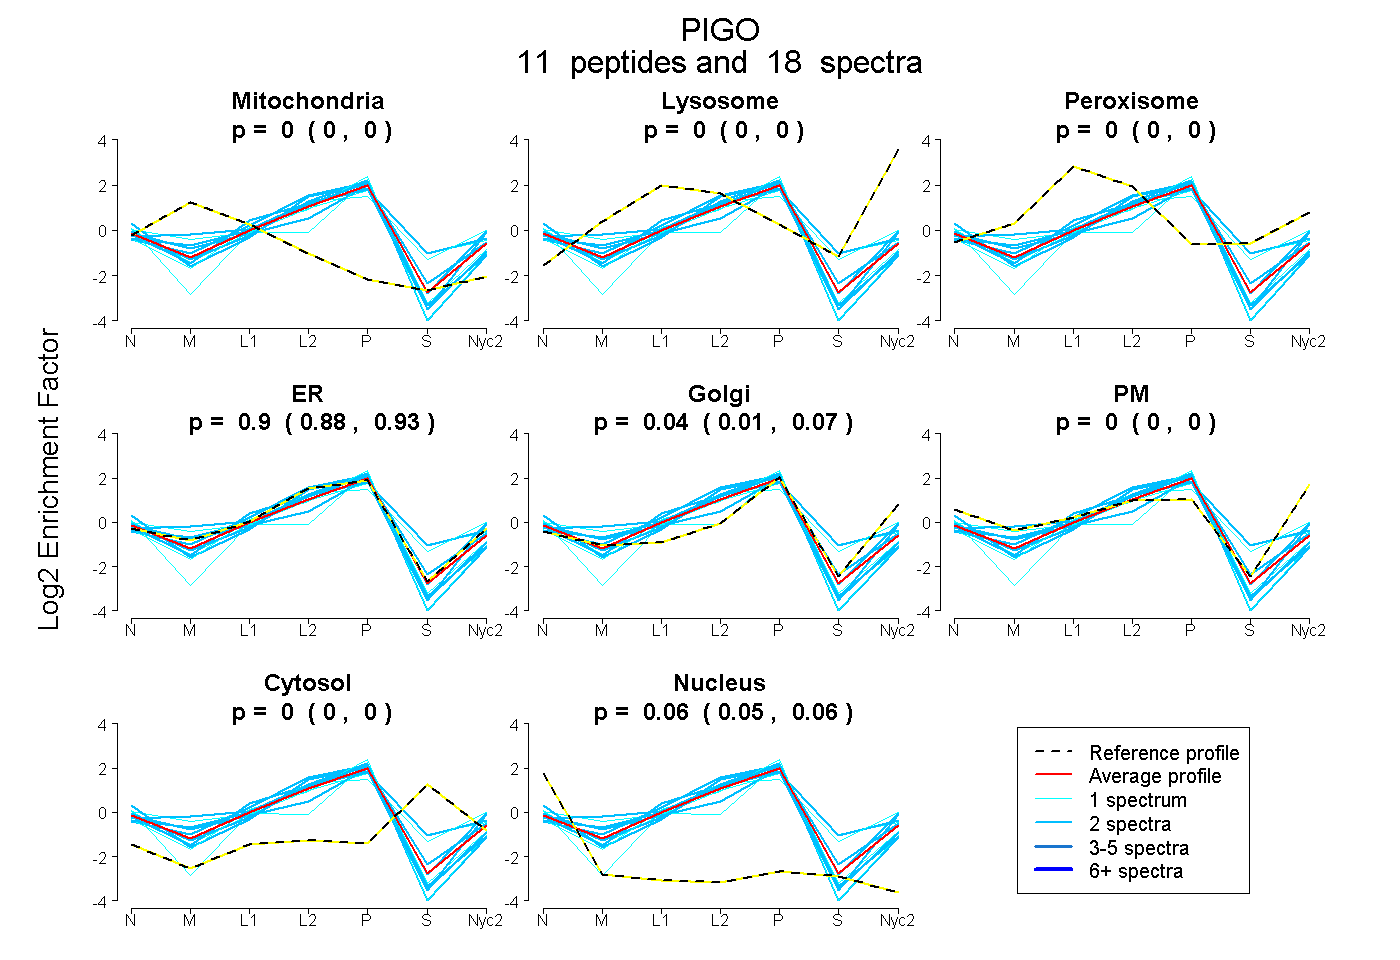
 11
11peptides
spectra
0.000 | 0.000
0.000 | 0.000
0.000 | 0.000
0.875 | 0.926
0.011 | 0.067
0.000 | 0.000
0.000 | 0.000
0.049 | 0.062
| Plot | Mito | Lyso | Perox | ER | Golgi | PM | Cytosol | Nucleus | |||||
| Expt A |
11 peptides |
18 spectra |
|
0.000 0.000 | 0.000 |
0.000 0.000 | 0.000 |
0.000 0.000 | 0.000 |
0.901 0.875 | 0.926 |
0.043 0.011 | 0.067 |
0.000 0.000 | 0.000 |
0.000 0.000 | 0.000 |
0.056 0.049 | 0.062 |
| 2 spectra, YQHLLQHPR | 0.059 | 0.000 | 0.000 | 0.843 | 0.019 | 0.079 | 0.000 | 0.000 | ||
| 2 spectra, ALVAGASAVLPR | 0.000 | 0.020 | 0.000 | 0.959 | 0.021 | 0.000 | 0.000 | 0.000 | ||
| 1 spectrum, HGPHHPEMAK | 0.000 | 0.000 | 0.096 | 0.619 | 0.000 | 0.157 | 0.128 | 0.000 | ||
| 2 spectra, LAGLFHR | 0.036 | 0.000 | 0.000 | 0.646 | 0.268 | 0.000 | 0.009 | 0.041 | ||
| 2 spectra, LVLAQQR | 0.000 | 0.000 | 0.000 | 0.926 | 0.000 | 0.000 | 0.000 | 0.074 | ||
| 1 spectrum, SSPWLSPLASMVGGR | 0.000 | 0.000 | 0.000 | 0.929 | 0.000 | 0.000 | 0.000 | 0.071 | ||
| 1 spectrum, AGAATSR | 0.000 | 0.000 | 0.006 | 0.761 | 0.000 | 0.000 | 0.233 | 0.000 | ||
| 2 spectra, VRPEEEQEEPLMEMR | 0.018 | 0.000 | 0.000 | 0.939 | 0.000 | 0.000 | 0.000 | 0.043 | ||
| 2 spectra, QSLPGSESEAR | 0.000 | 0.000 | 0.000 | 0.916 | 0.000 | 0.000 | 0.000 | 0.084 | ||
| 1 spectrum, LGSSAPTAPPR | 0.000 | 0.000 | 0.000 | 0.532 | 0.310 | 0.000 | 0.000 | 0.159 | ||
| 2 spectra, AWLSWGSK | 0.000 | 0.000 | 0.095 | 0.725 | 0.000 | 0.000 | 0.180 | 0.000 |
| Plot | Mito | Lyso or Perox | ER | Golgi | PM | Cytosol | Nucleus | ||||||
| Expt B |
2 peptides |
3 spectra |
 |
0.000 0.000 | 0.000 |
0.000 0.000 | 0.000 |
0.957 0.861 | 0.999 |
0.000 0.000 | 0.000 |
0.037 0.000 | 0.129 |
0.000 0.000 | 0.000 |
0.006 0.000 | 0.025 |
|||
| Plot | Lyso | Other | |||||||||||
| Expt C |
2 peptides |
3 spectra |
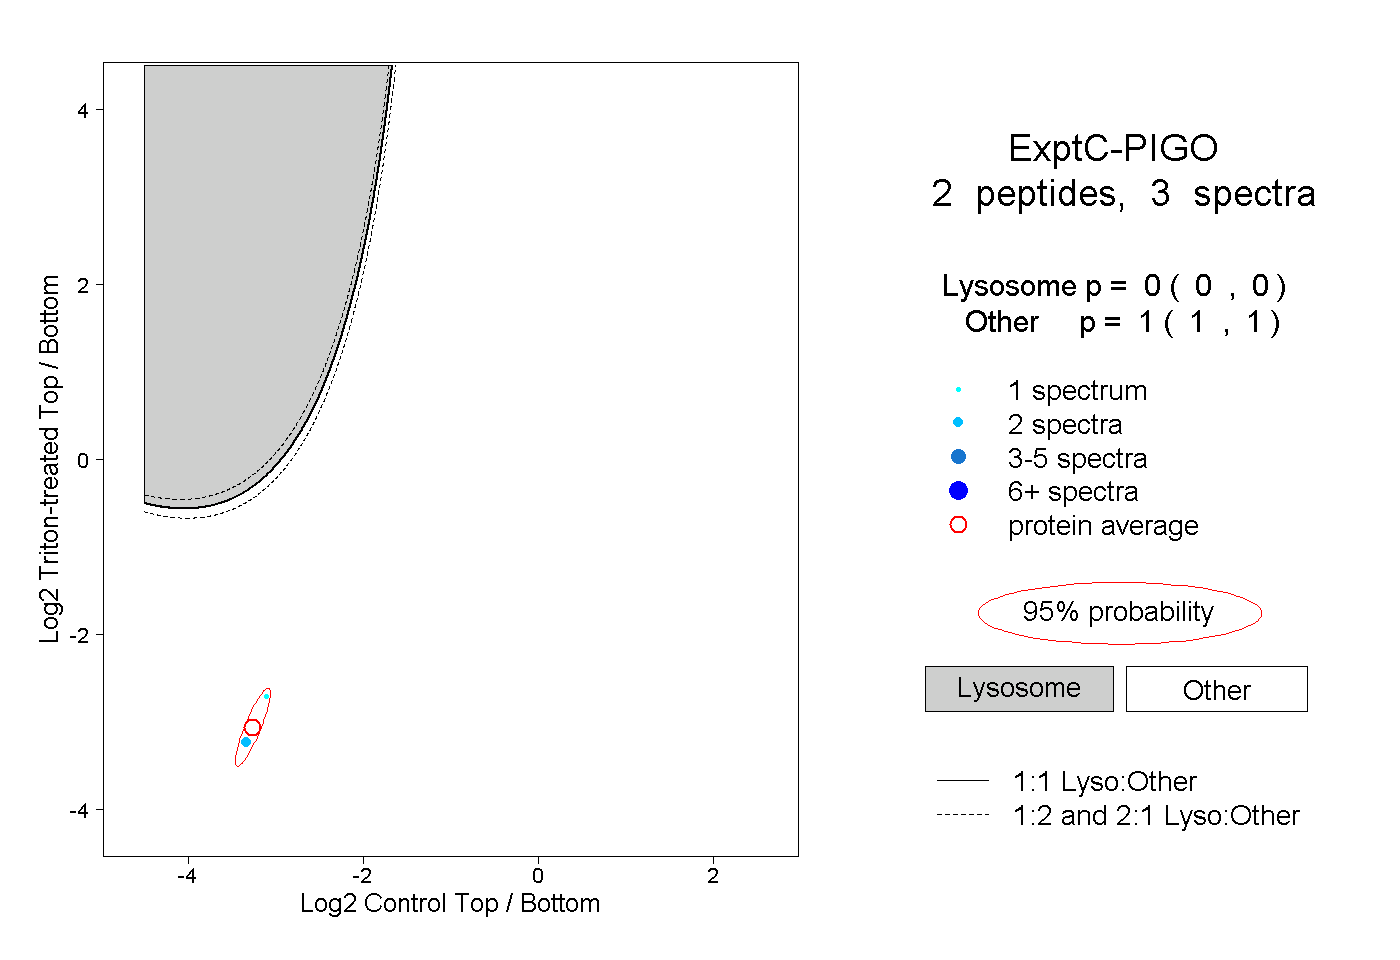 |
0.000 0.000 | 0.000 |
1.000 1.000 | 1.000 |
||||||||
| Plot | Lyso | Other | |||||||||||
| Expt D |
1 peptide |
1 spectrum |
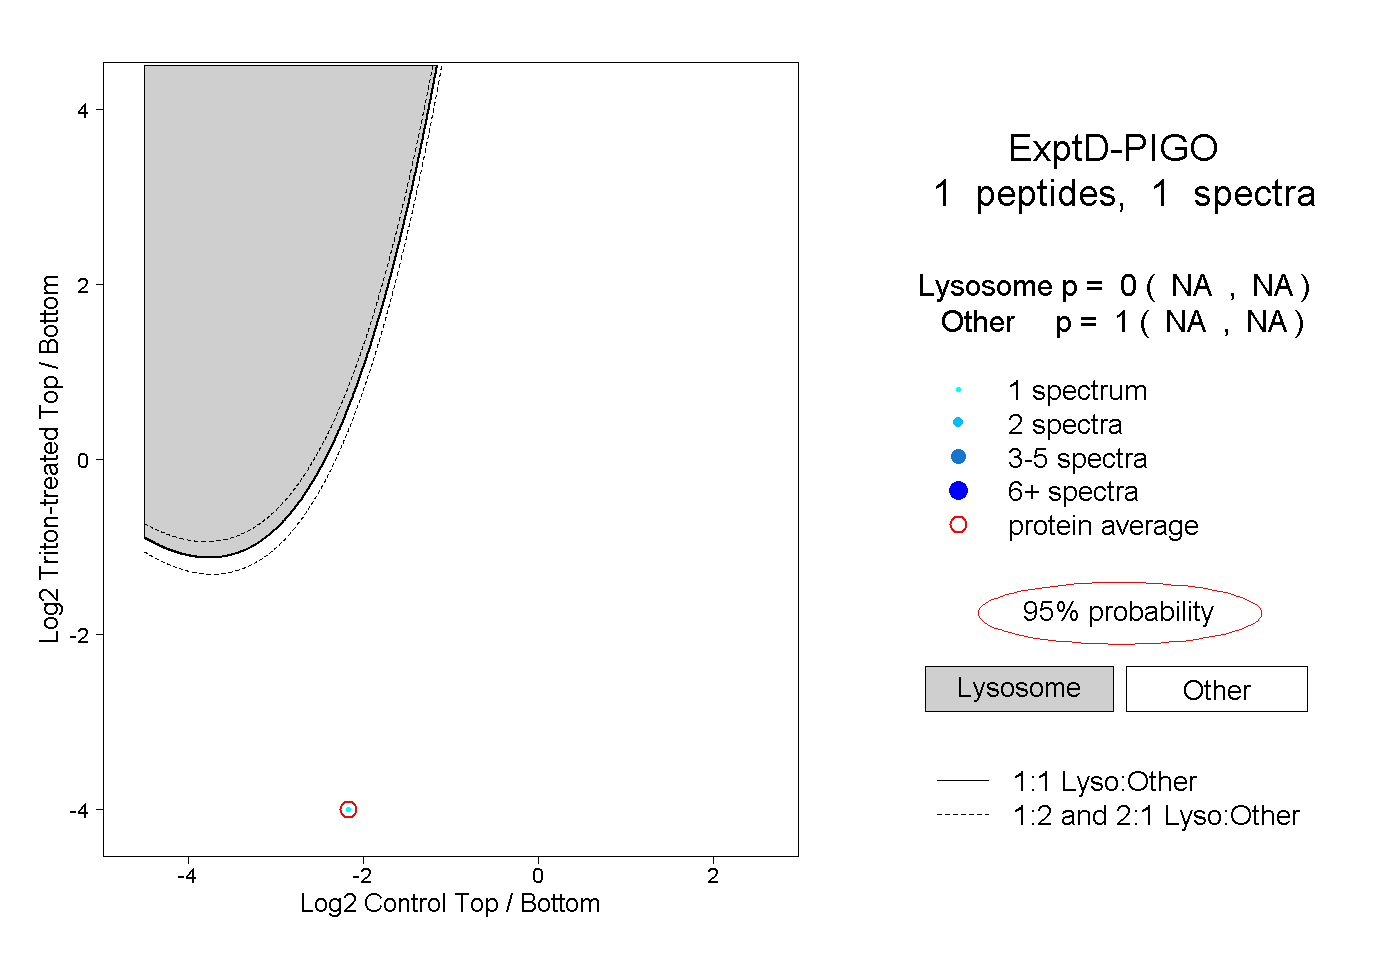 |
0.000 NA | NA |
1.000 NA | NA |