 2
2peptides
spectra
NA | NA
NA | NA
NA | NA
NA | NA
NA | NA
NA | NA
NA | NA
NA | NA
| Plot | Mito | Lyso | Perox | ER | Golgi | PM | Cytosol | Nucleus | |||||
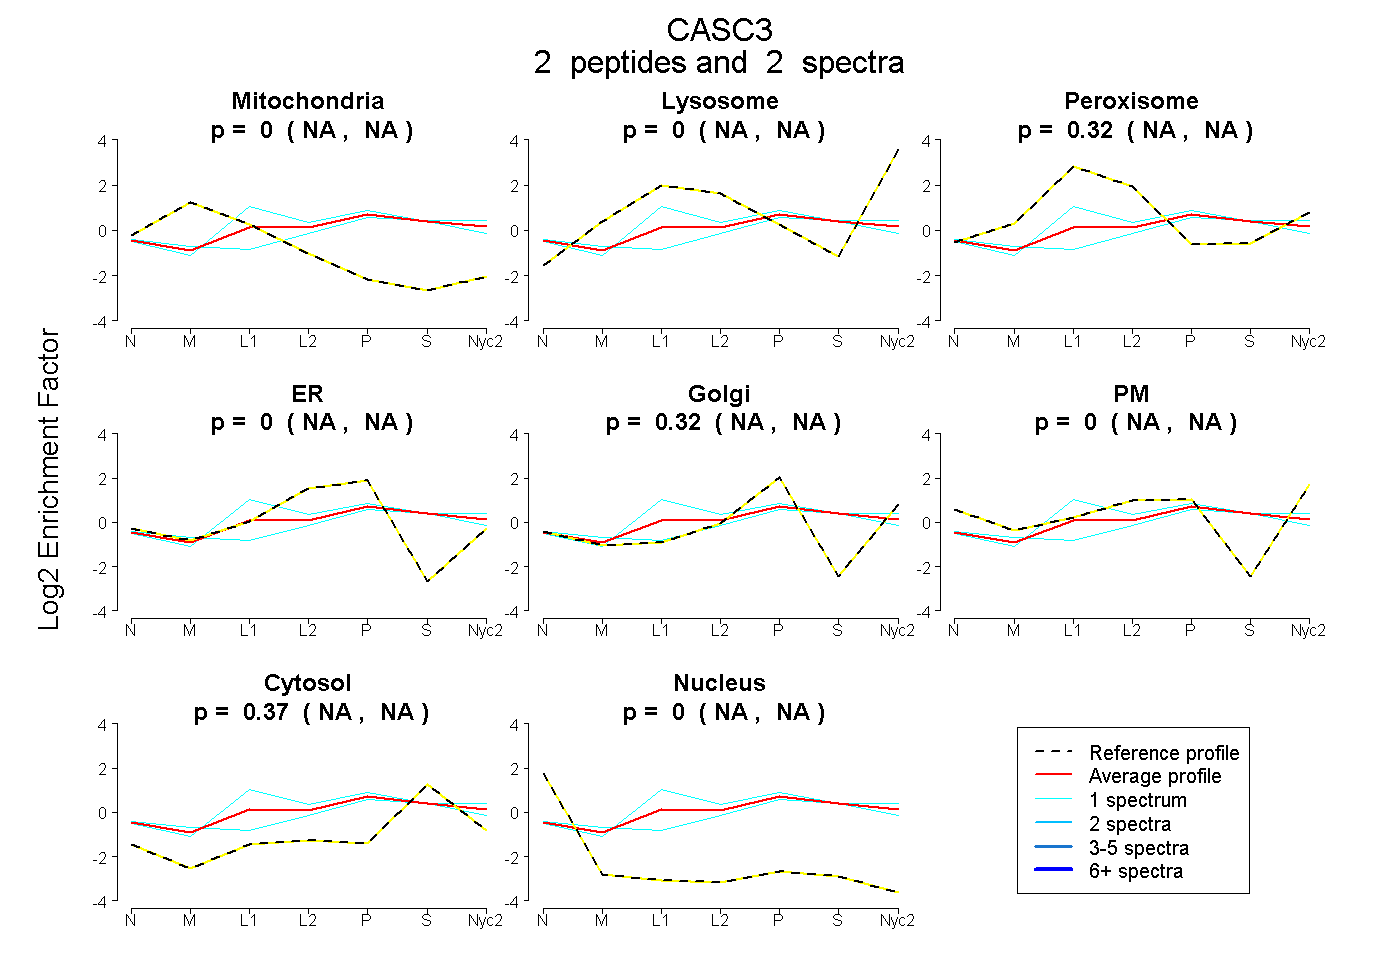
| Expt A |
2 peptides |
2 spectra |
|
0.000 NA | NA |
0.000 NA | NA |
0.316 NA | NA |
0.000 NA | NA |
0.318 NA | NA |
0.000 NA | NA |
0.366 NA | NA |
0.000 NA | NA |
| 1 spectrum, SEANDAADSSAK | 0.000 | 0.077 | 0.066 | 0.000 | 0.236 | 0.158 | 0.463 | 0.000 | ||
| 1 spectrum, GLFFEHDLR | 0.000 | 0.000 | 0.405 | 0.142 | 0.126 | 0.000 | 0.328 | 0.000 |
| Plot | Mito | Lyso or Perox | ER | Golgi | PM | Cytosol | Nucleus | ||||||
| Expt B |
1 peptide |
2 spectra |
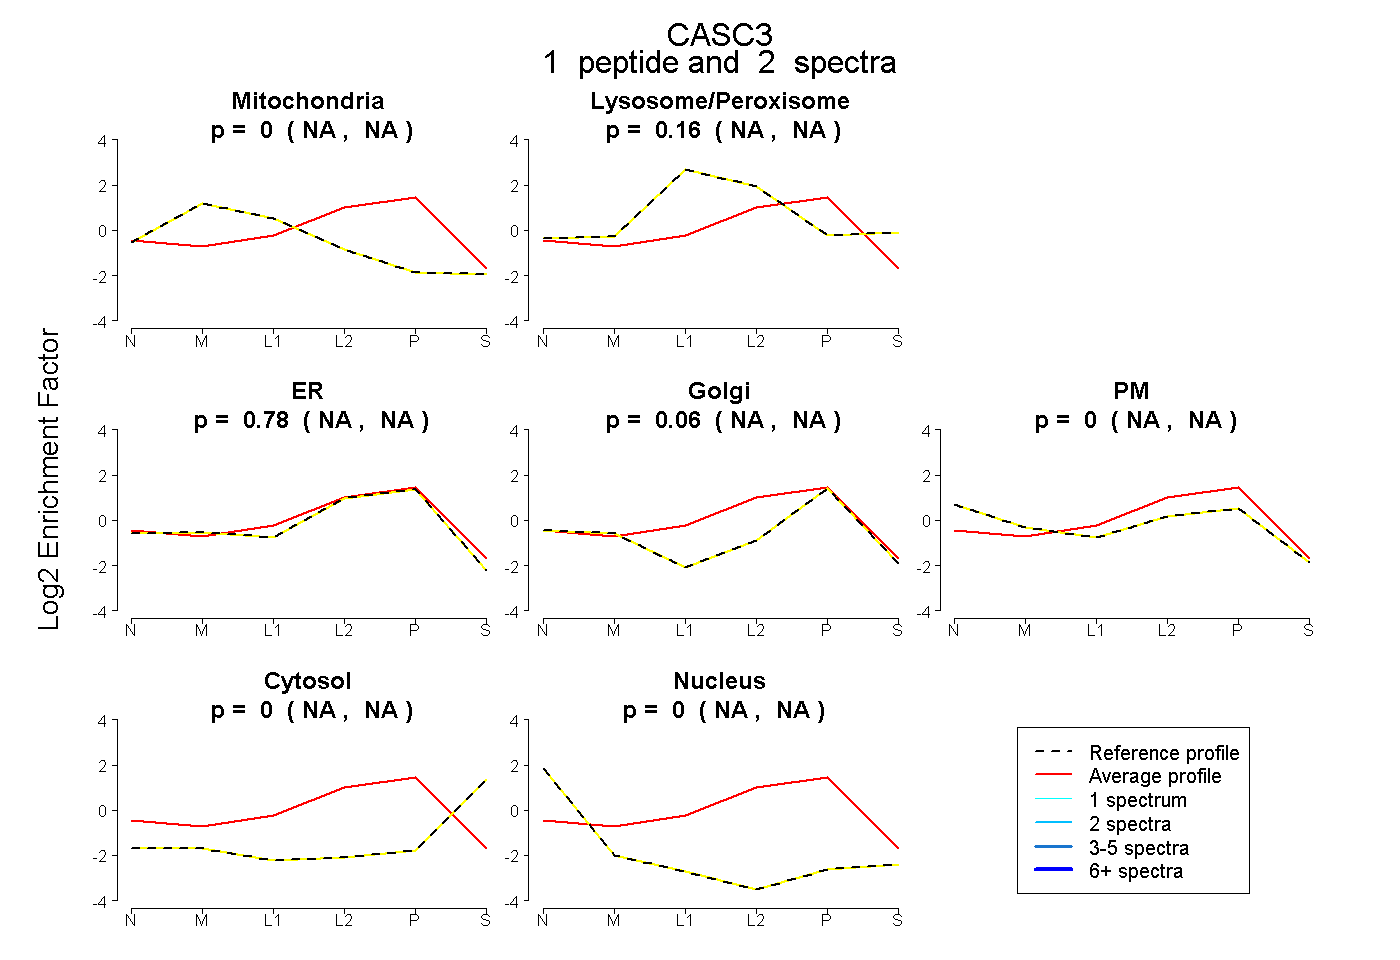 |
0.000 NA | NA |
0.160 NA | NA |
0.777 NA | NA |
0.062 NA | NA |
0.000 NA | NA |
0.000 NA | NA |
0.000 NA | NA |
|||
| Plot | Lyso | Other | |||||||||||
| Expt C |
1 peptide |
1 spectrum |
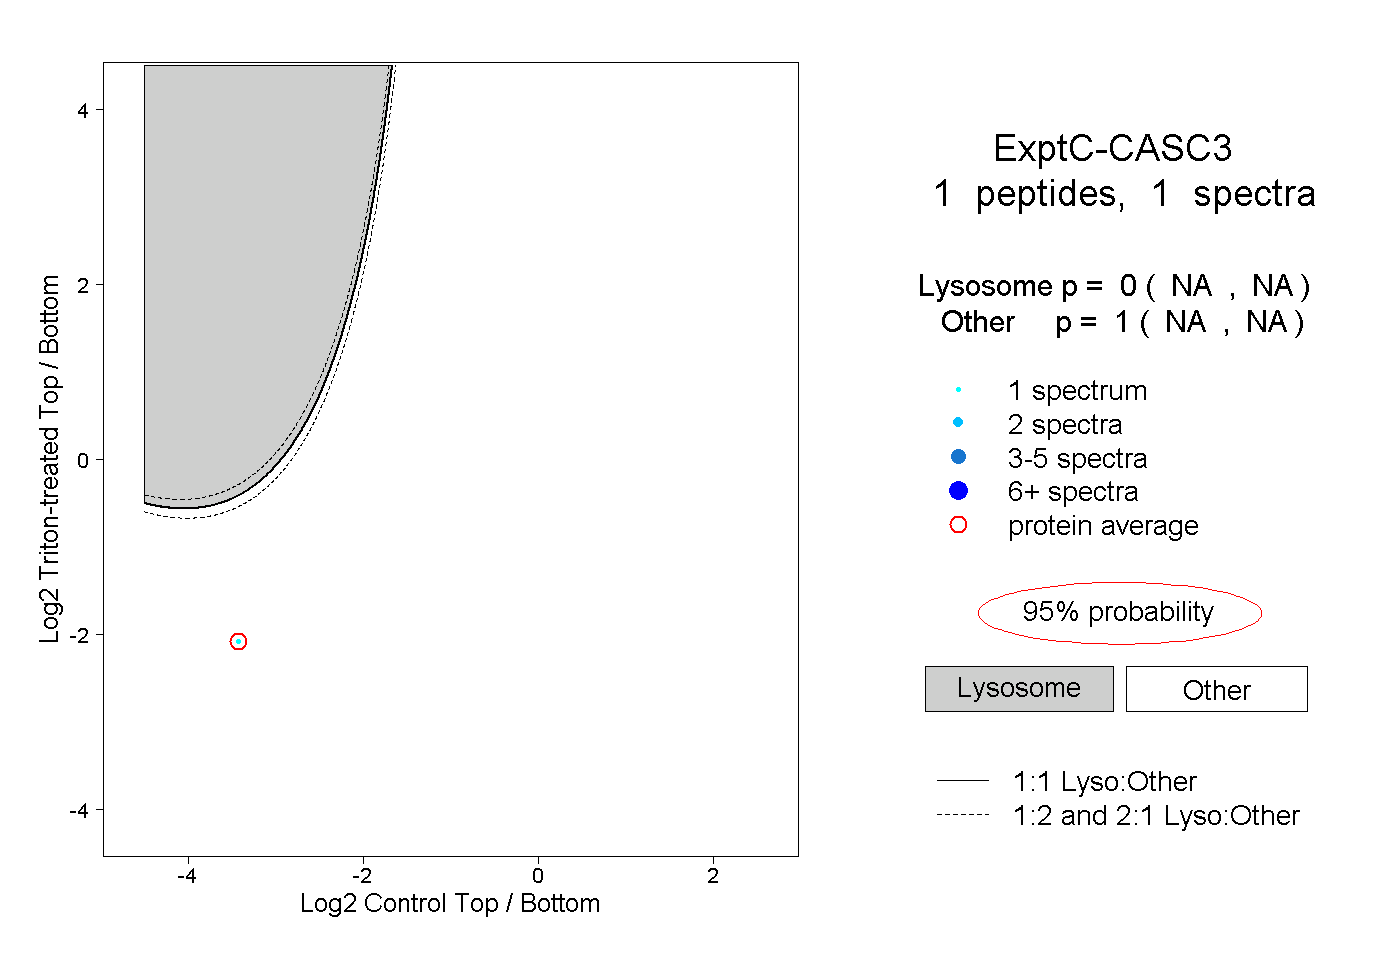 |
0.000 NA | NA |
1.000 NA | NA |