 2
2peptides
spectra
0.000 | 0.089
0.000 | 0.049
0.000 | 0.086
0.000 | 0.389
0.000 | 0.411
0.000 | 0.360
0.000 | 0.490
0.137 | 0.476
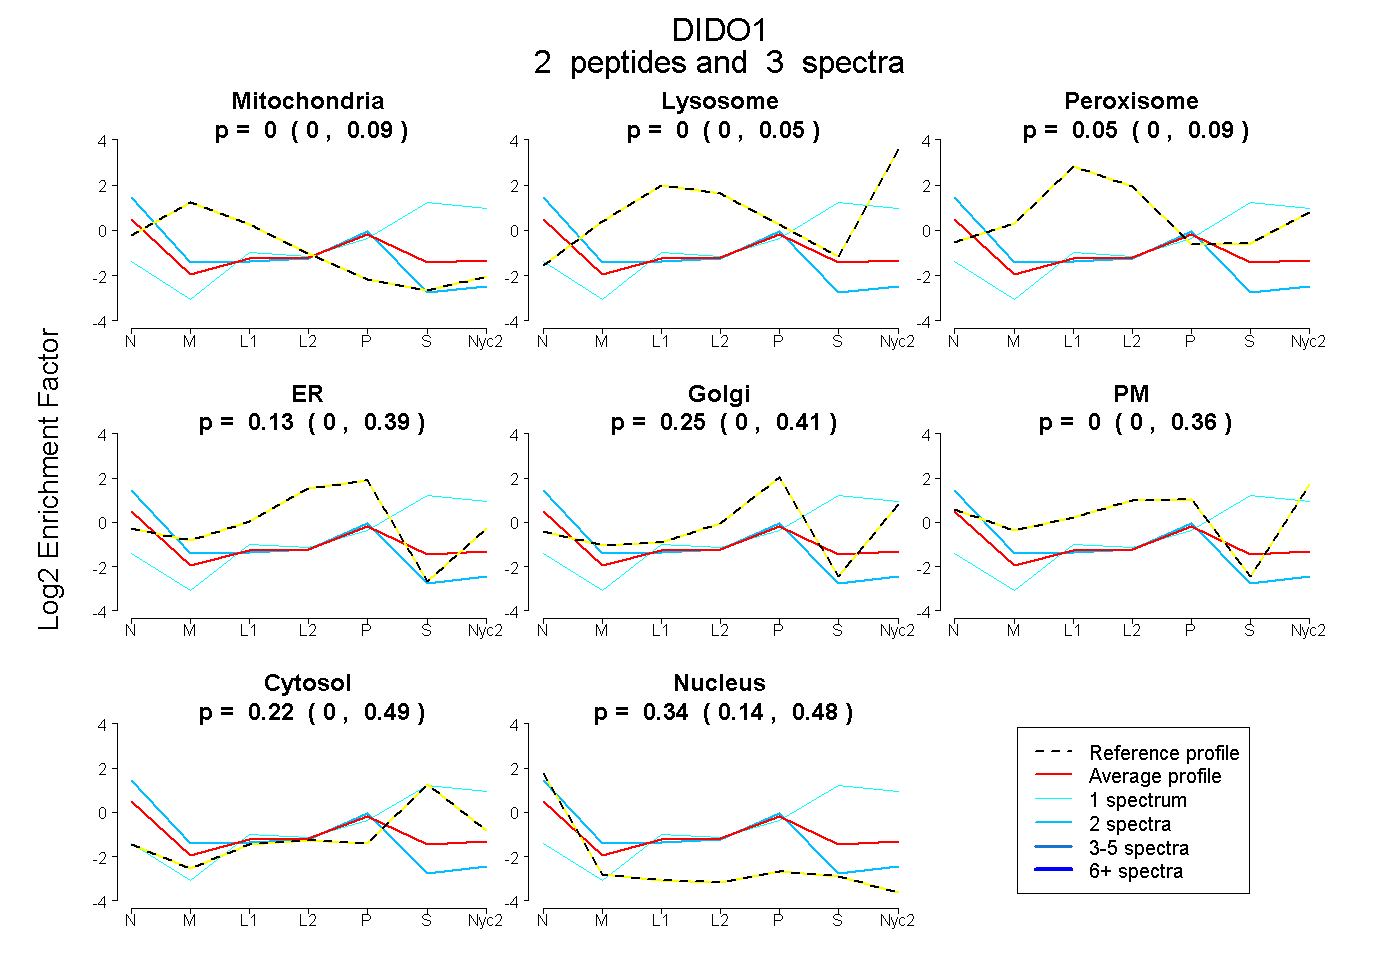
| Plot | Mito | Lyso | Perox | ER | Golgi | PM | Cytosol | Nucleus | |||||
| Expt A |
2 peptides |
3 spectra |
|
0.000 0.000 | 0.089 |
0.000 0.000 | 0.049 |
0.053 0.000 | 0.086 |
0.134 0.000 | 0.389 |
0.254 0.000 | 0.411 |
0.000 0.000 | 0.360 |
0.219 0.000 | 0.490 |
0.340 0.137 | 0.476 |