7
7peptides
spectra
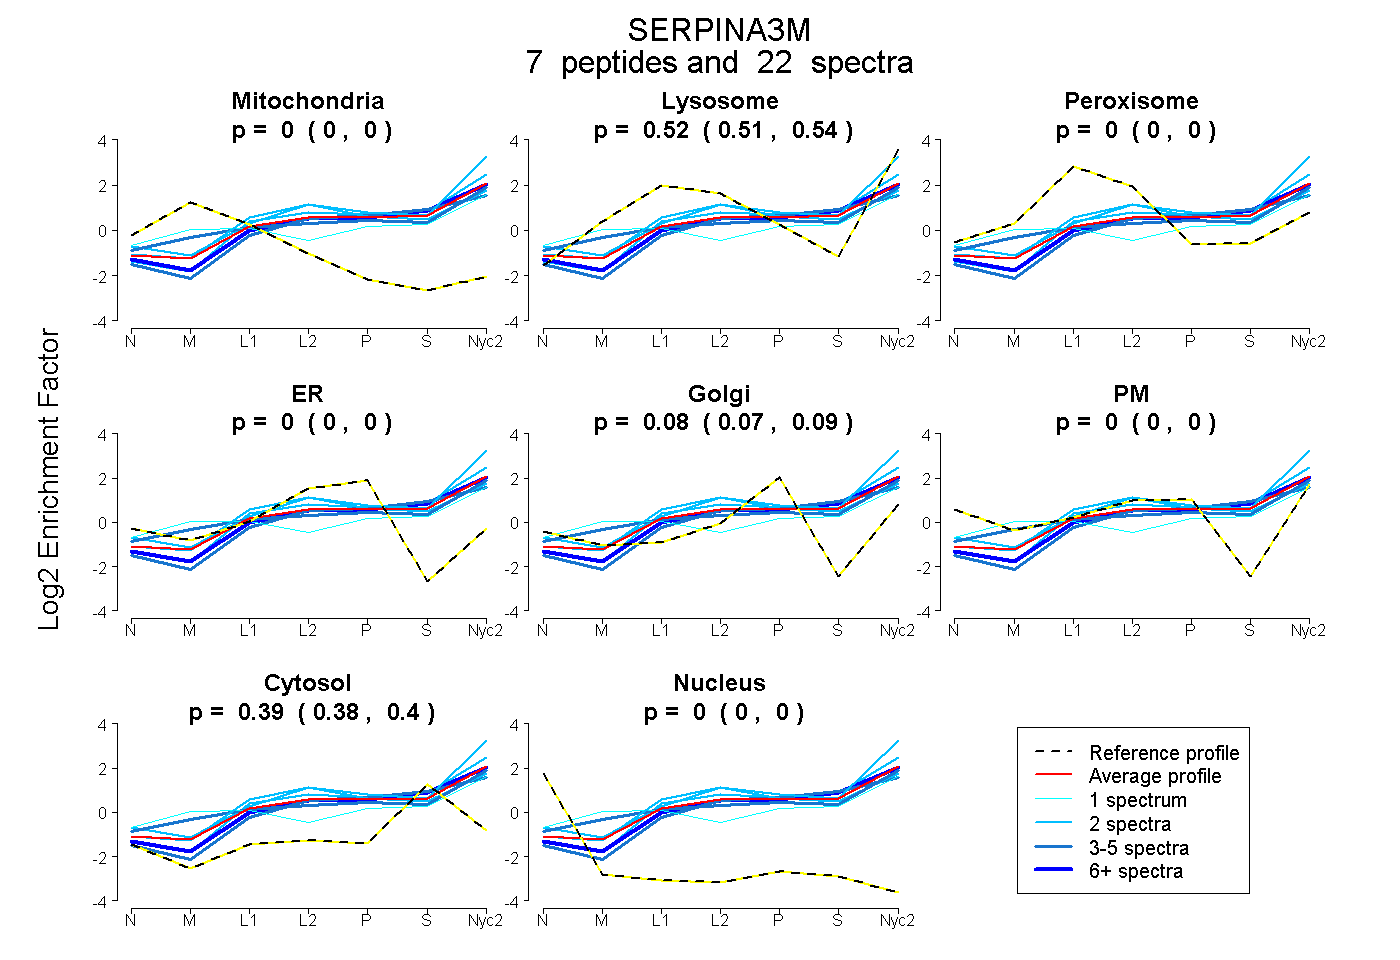
0.000 | 0.000
0.507 | 0.535
0.000 | 0.000
0.000 | 0.000
0.073 | 0.092
0.000 | 0.000
0.383 | 0.403
0.000 | 0.000
3peptides
spectra
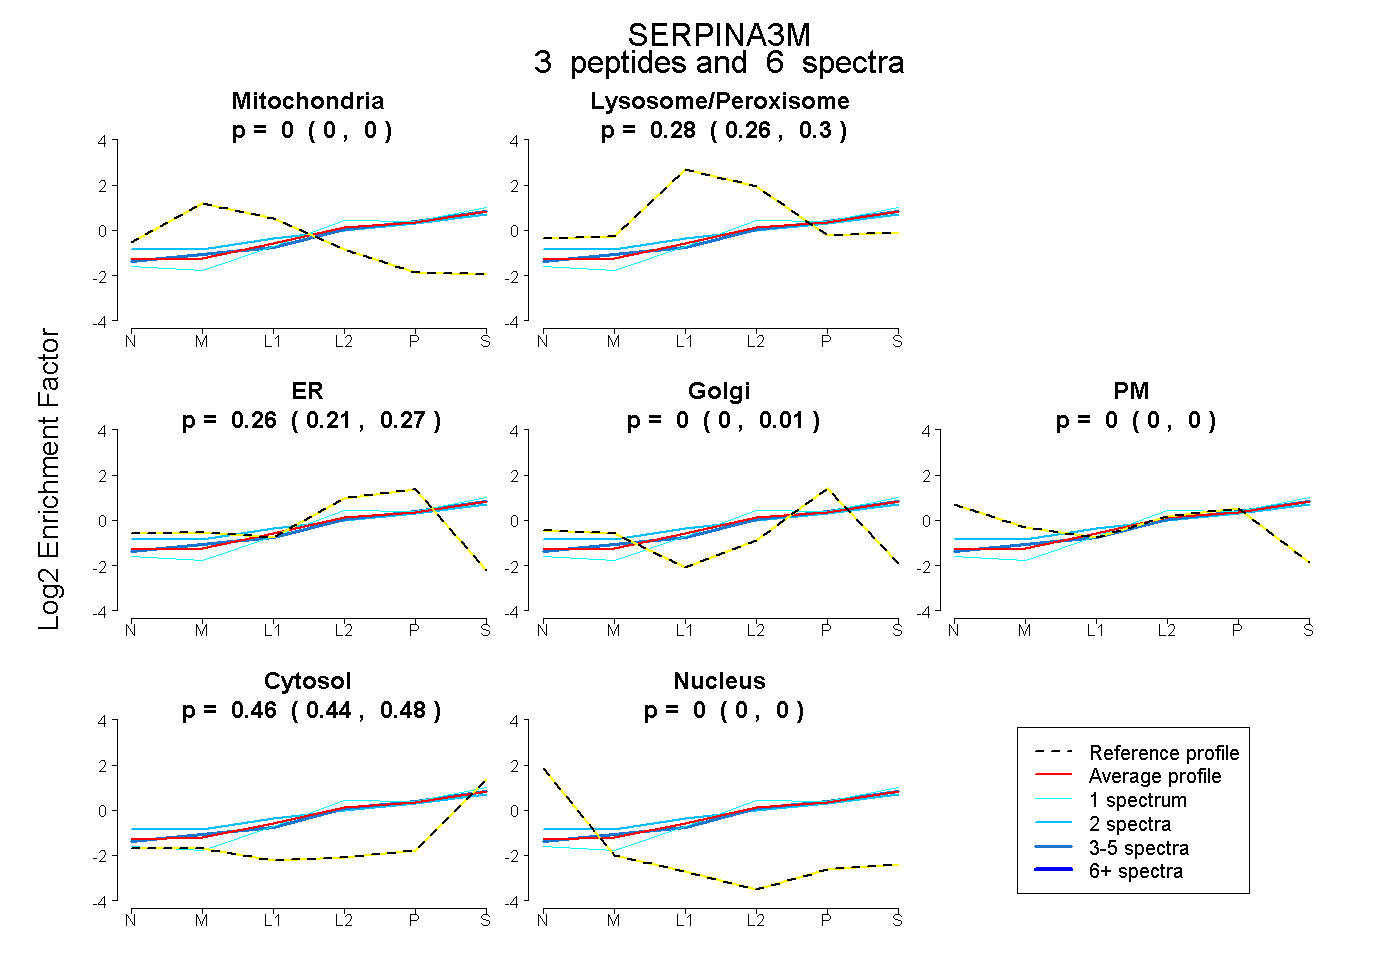
0.000 | 0.000
0.257 | 0.302
0.213 | 0.272
0.000 | 0.014
0.000 | 0.000
0.444 | 0.476
0.000 | 0.000
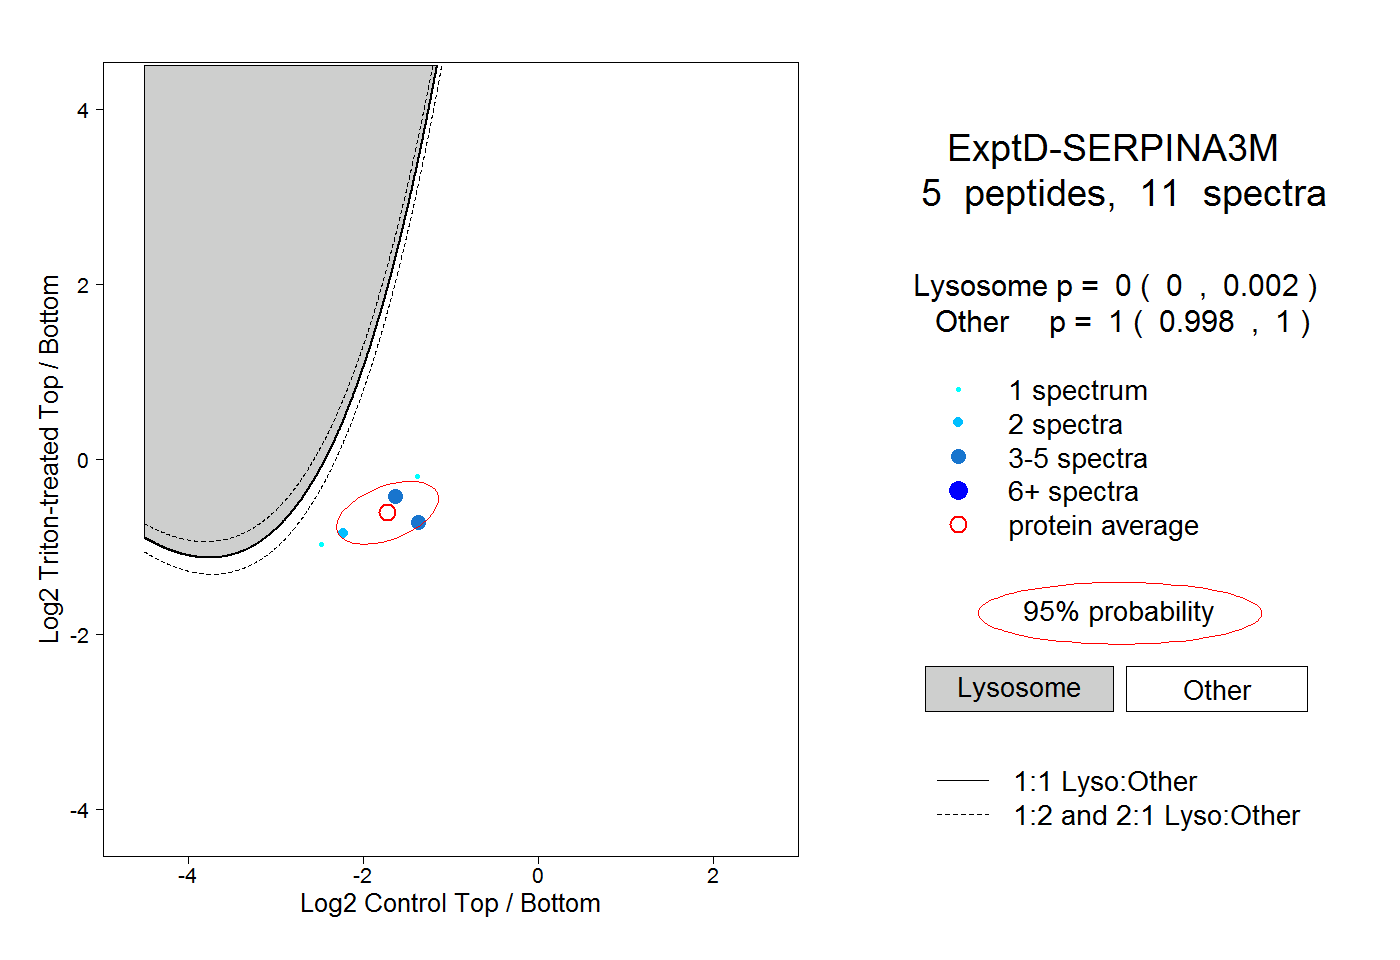
11peptides
spectra
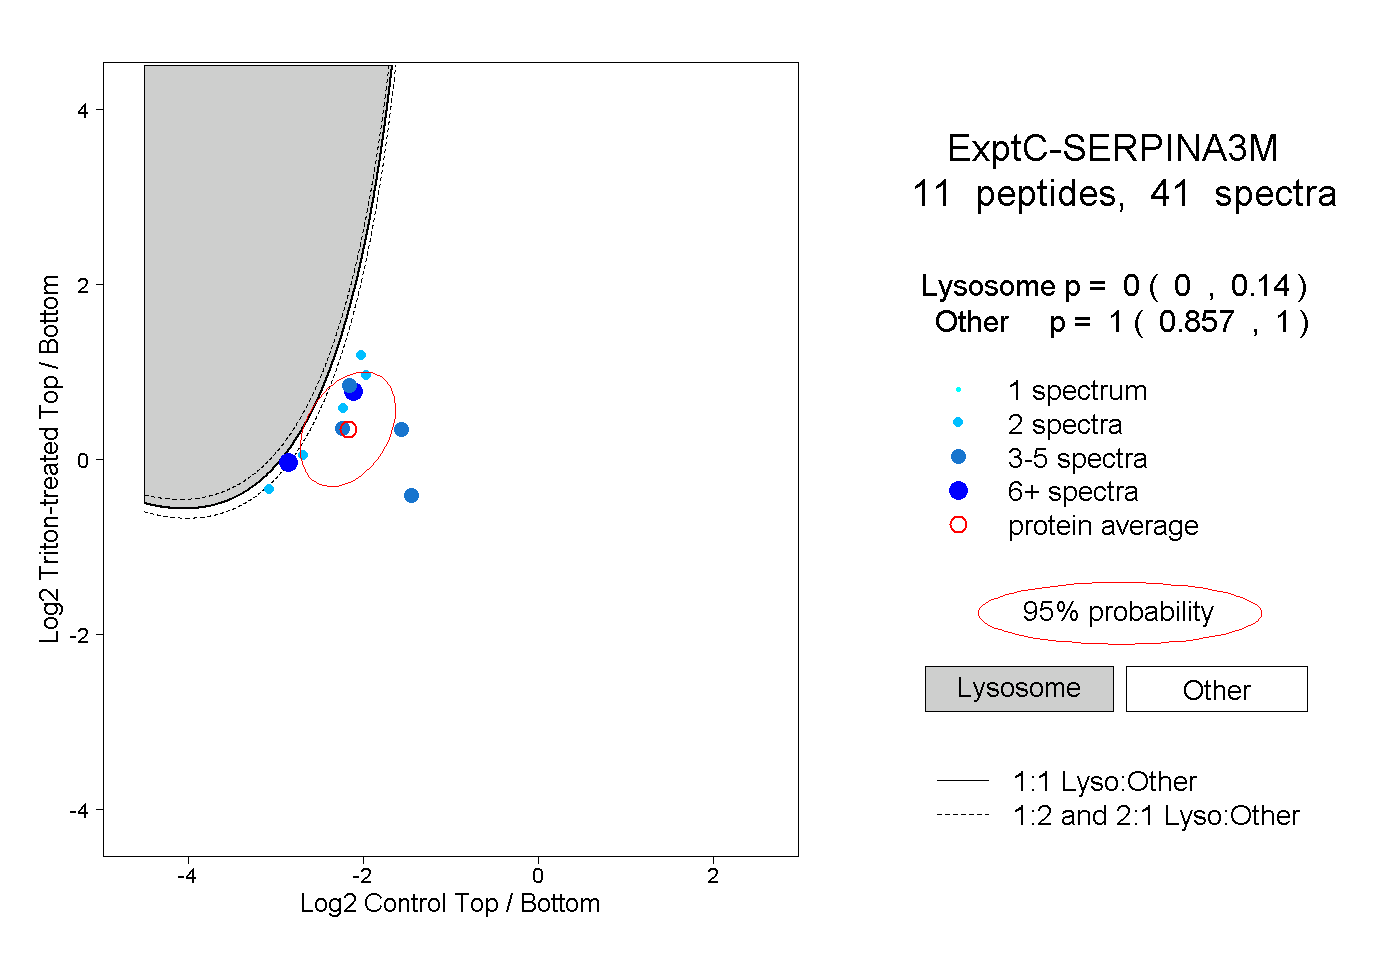
0.000 | 0.140
0.857 | 1.000