SERPINA3M
[ENSRNOP00000013175]
Main page
| | | Plot |
Mito |
Lyso |
|
Perox |
ER |
Golgi |
PM |
Cytosol |
Nucleus |
|
| Expt A |
 7
7
peptides |
22
spectra |
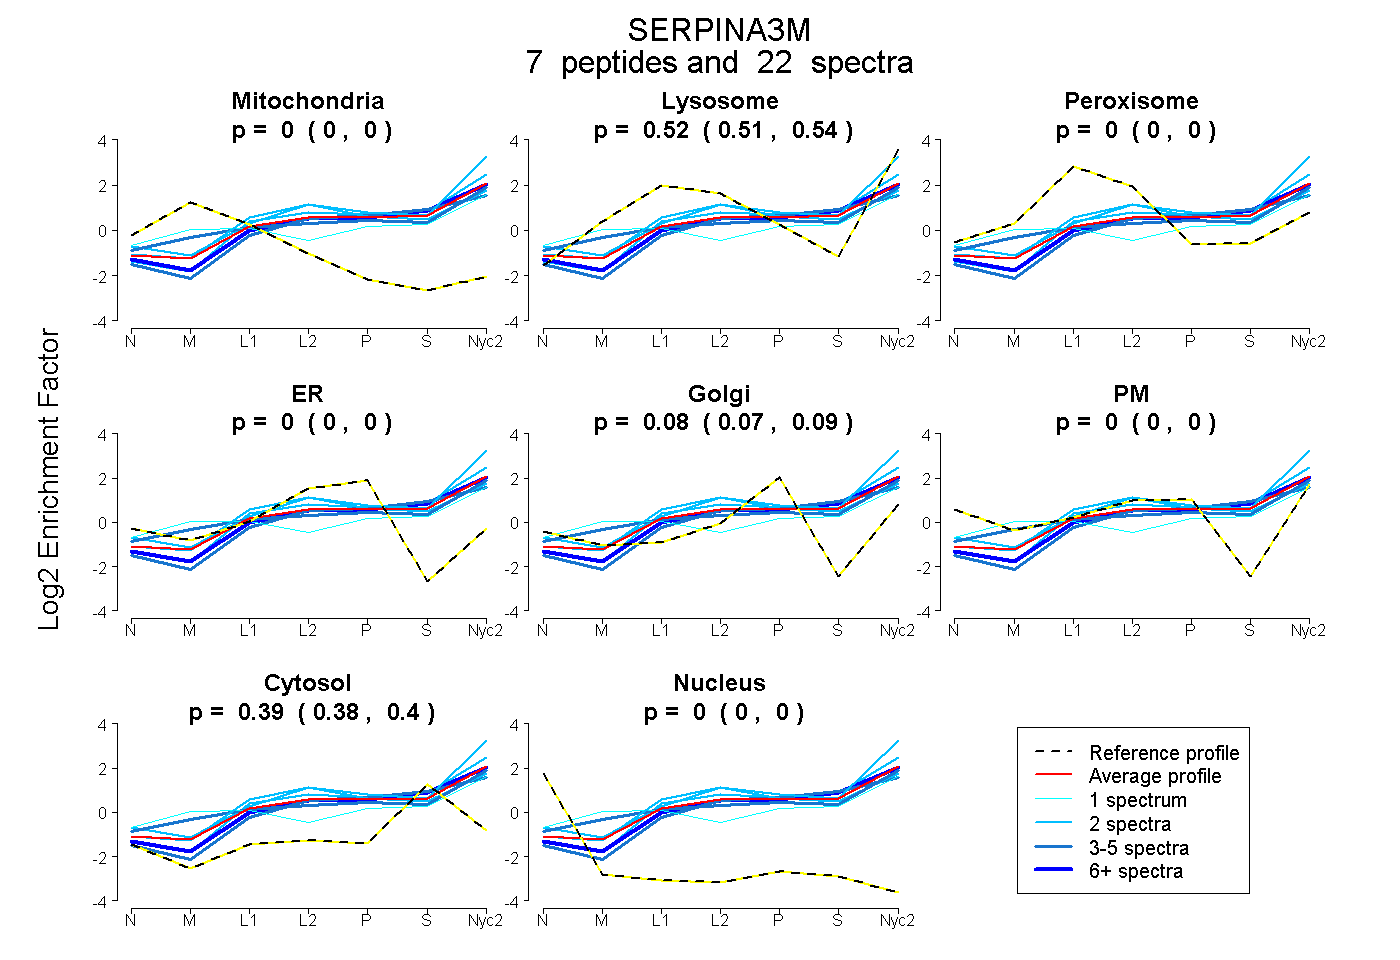 |
0.000
0.000 | 0.000 |
0.523
0.507 | 0.535 |
|
0.000
0.000 | 0.000 |
0.000
0.000 | 0.000 |
0.083
0.073 | 0.092 |
0.000
0.000 | 0.000 |
0.394
0.383 | 0.403 |
0.000
0.000 | 0.000 |
|
| | | Plot |
Mito |
|
Lyso or Perox |
|
ER |
Golgi |
PM |
Cytosol |
Nucleus |
|
| Expt B |
3
peptides |
6
spectra |
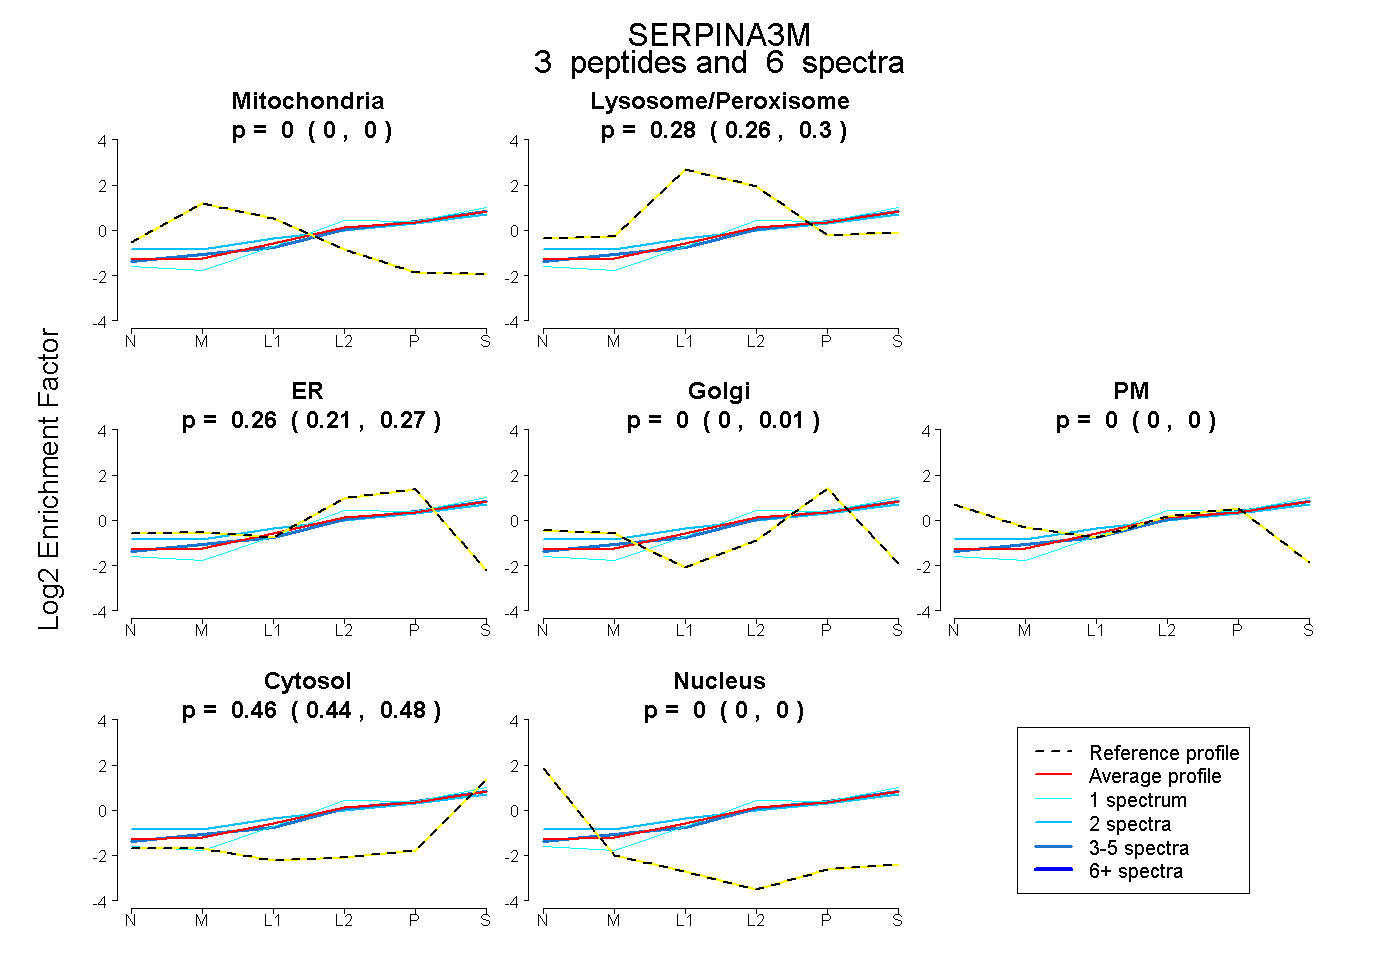 |
0.000
0.000 | 0.000 |
|
0.280
0.257 | 0.302 |
|
0.257
0.213 | 0.272 |
0.000
0.000 | 0.014 |
0.000
0.000 | 0.000 |
0.463
0.444 | 0.476 |
0.000
0.000 | 0.000 |
|
| 1 spectrum, IQELVSGLK |
0.000 |
|
0.278 |
|
0.239 |
0.000 |
0.000 |
0.483 |
0.000 |
|
| 2 spectra, DVFSQQADLSR |
0.000 |
|
0.402 |
|
0.000 |
0.239 |
0.000 |
0.359 |
0.000 |
|
| 3 spectra, GNTLEEILEVLR |
0.000 |
|
0.246 |
|
0.281 |
0.000 |
0.000 |
0.473 |
0.000 |
|
| | | Plot |
|
Lyso |
|
|
|
|
|
|
|
Other |
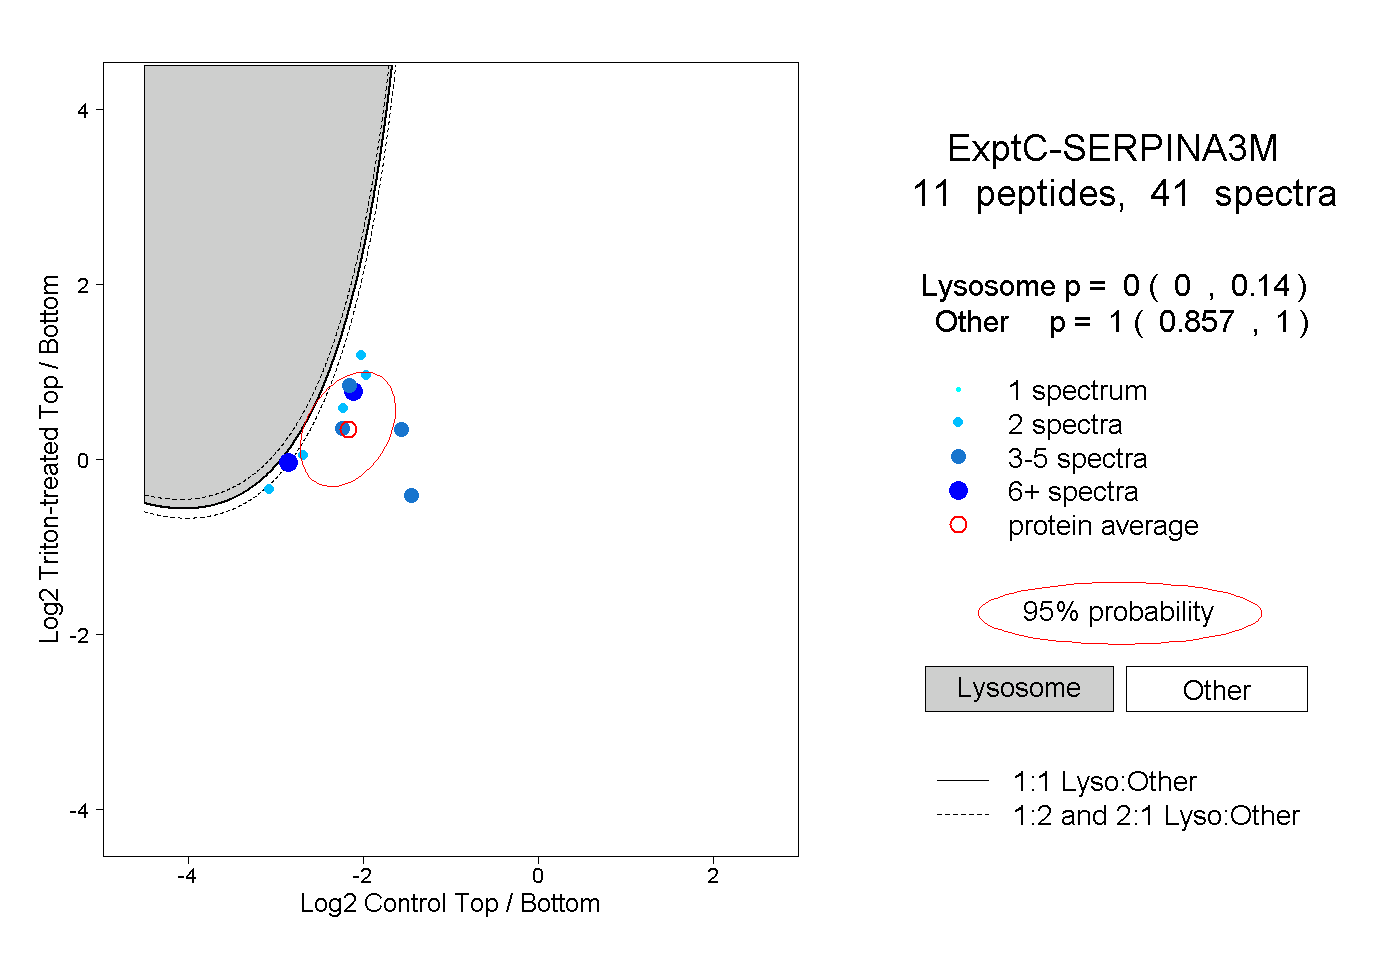
| Expt C |
11
peptides |
41
spectra |
 |
|
0.000
0.000 | 0.140 |
|
|
|
|
|
|
|
1.000
0.857 | 1.000 |
| | | Plot |
|
Lyso |
|
|
|
|
|
|
|
Other |
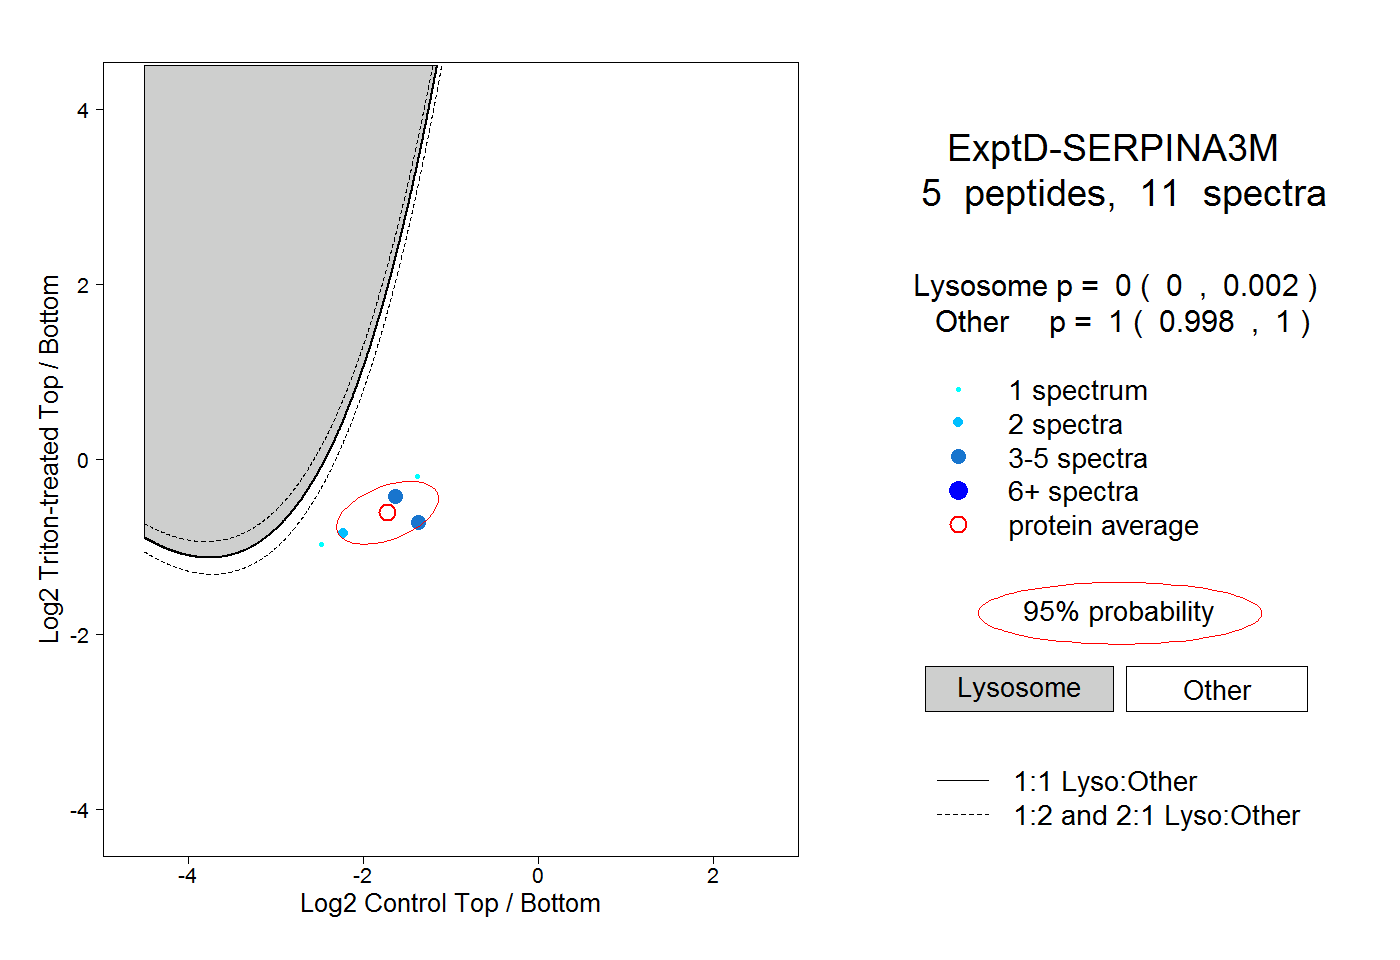
| Expt D |
5
peptides |
11
spectra |
 |
|
0.000
0.000 | 0.002 |
|
|
|
|
|
|
|
1.000
0.998 | 1.000 |