 7
7peptides
spectra
0.000 | 0.000
0.507 | 0.535
0.000 | 0.000
0.000 | 0.000
0.073 | 0.092
0.000 | 0.000
0.383 | 0.403
0.000 | 0.000
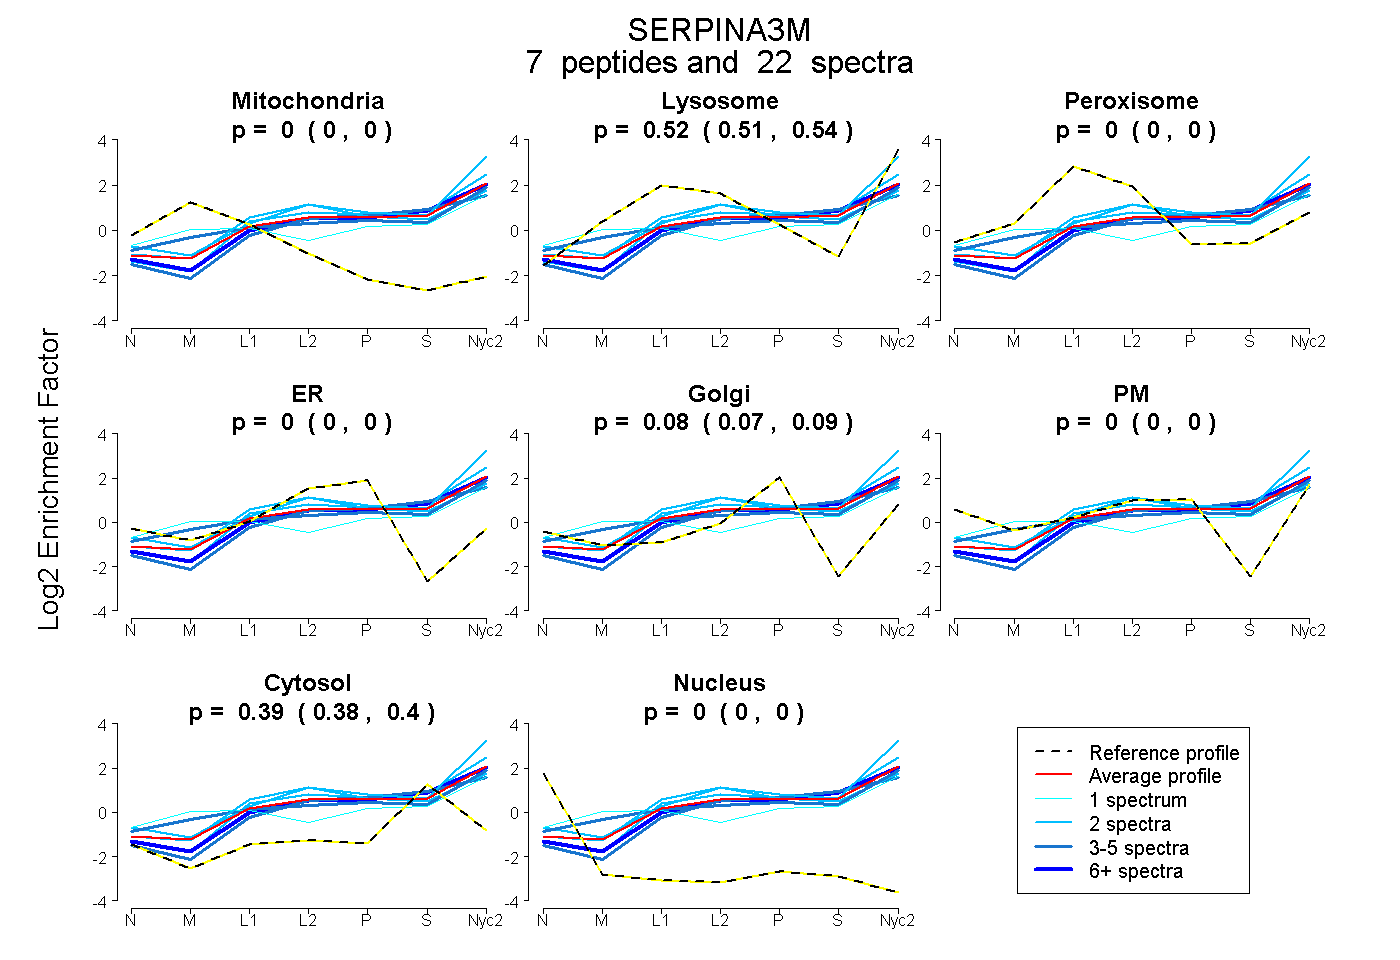
| Plot | Mito | Lyso | Perox | ER | Golgi | PM | Cytosol | Nucleus | |||||
| Expt A |
7 peptides |
22 spectra |
|
0.000 0.000 | 0.000 |
0.523 0.507 | 0.535 |
0.000 0.000 | 0.000 |
0.000 0.000 | 0.000 |
0.083 0.073 | 0.092 |
0.000 0.000 | 0.000 |
0.394 0.383 | 0.403 |
0.000 0.000 | 0.000 |
| 1 spectrum, NLQVLAEFQEK | 0.032 | 0.426 | 0.000 | 0.000 | 0.080 | 0.082 | 0.380 | 0.000 | ||
| 2 spectra, ALYQVEAFTADFQQPR | 0.000 | 0.586 | 0.000 | 0.000 | 0.010 | 0.000 | 0.404 | 0.000 | ||
| 4 spectra, LINDYVR | 0.000 | 0.512 | 0.000 | 0.000 | 0.101 | 0.037 | 0.350 | 0.000 | ||
| 5 spectra, GNTLEEILEVLR | 0.000 | 0.394 | 0.000 | 0.000 | 0.095 | 0.000 | 0.511 | 0.000 | ||
| 2 spectra, IITGNALFIDK | 0.000 | 0.472 | 0.000 | 0.079 | 0.000 | 0.095 | 0.353 | 0.000 | ||
| 6 spectra, DVFSQQADLSR | 0.000 | 0.482 | 0.000 | 0.000 | 0.058 | 0.000 | 0.460 | 0.000 | ||
| 2 spectra, TSMVLVNYLLFR | 0.000 | 0.713 | 0.000 | 0.000 | 0.010 | 0.000 | 0.277 | 0.000 |
| Plot | Mito | Lyso or Perox | ER | Golgi | PM | Cytosol | Nucleus | ||||||
| Expt B |
3 peptides |
6 spectra |
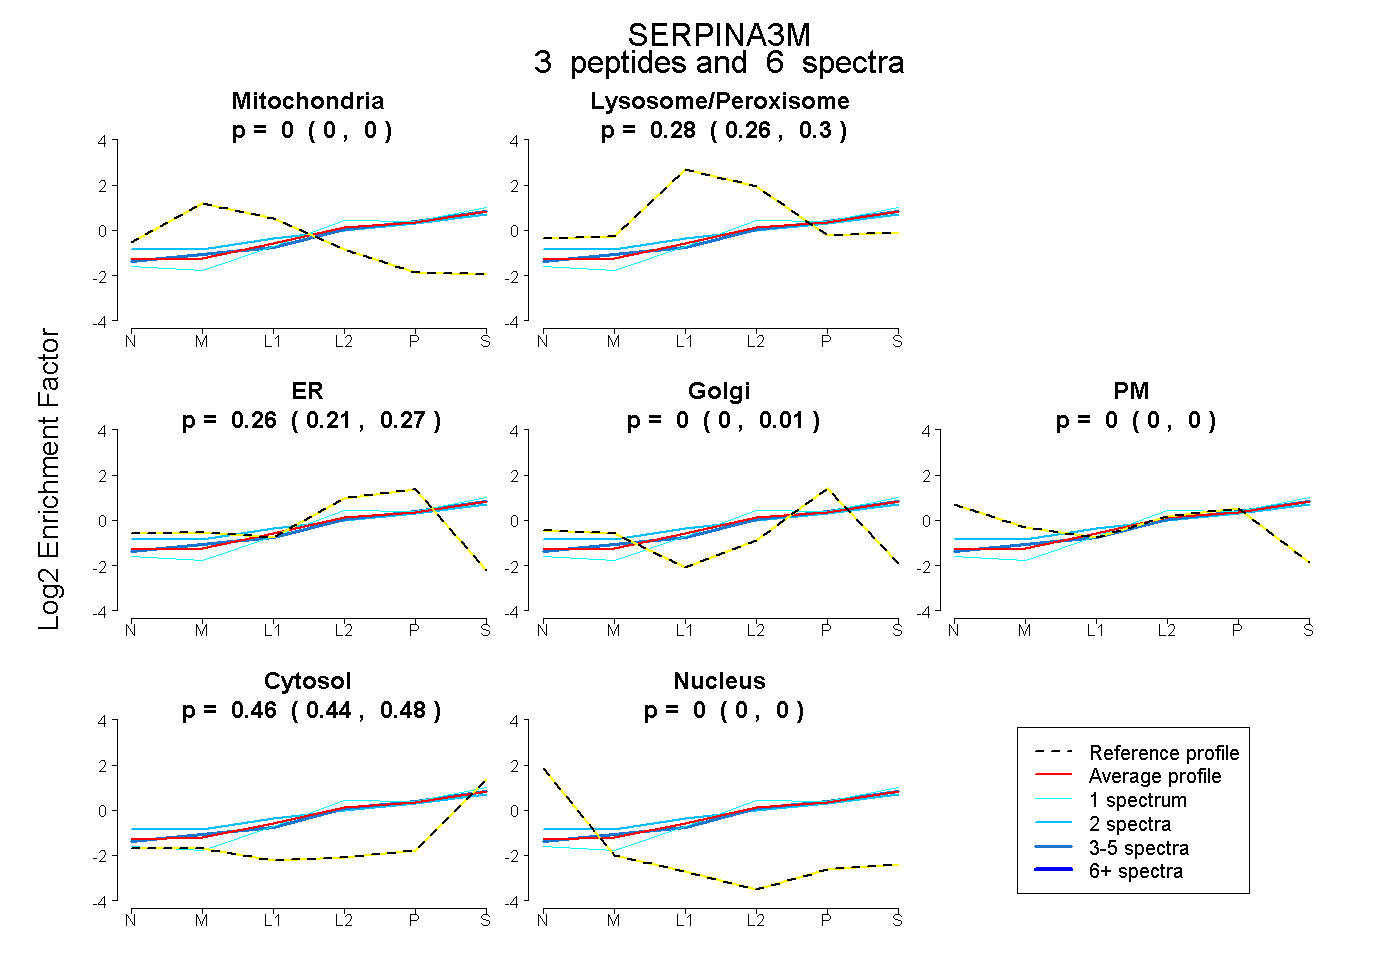 |
0.000 0.000 | 0.000 |
0.280 0.257 | 0.302 |
0.257 0.213 | 0.272 |
0.000 0.000 | 0.014 |
0.000 0.000 | 0.000 |
0.463 0.444 | 0.476 |
0.000 0.000 | 0.000 |
|||
| Plot | Lyso | Other | |||||||||||
| Expt C |
11 peptides |
41 spectra |
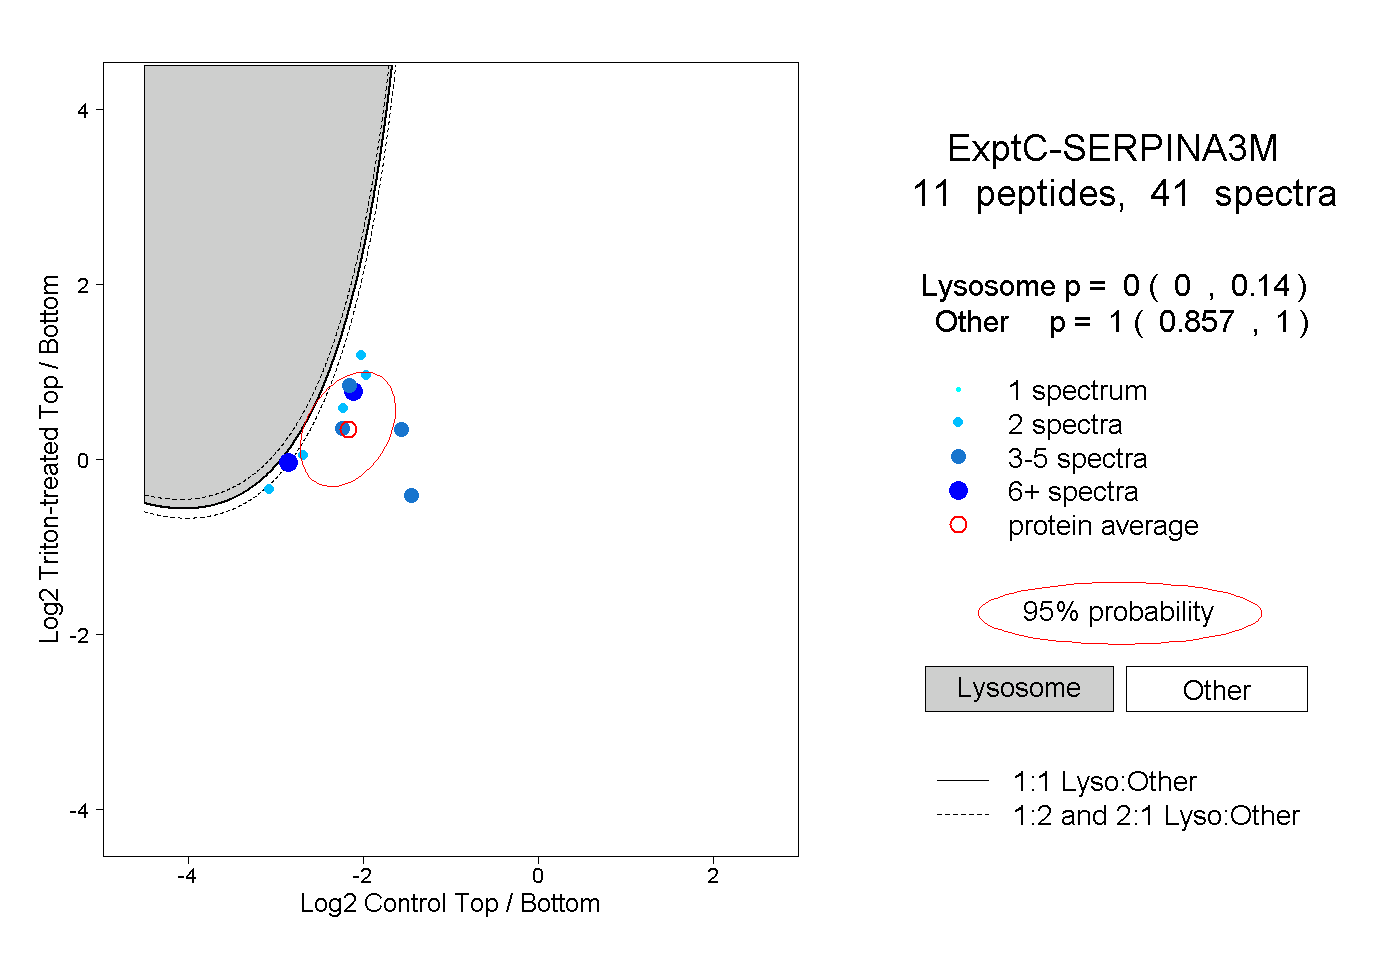 |
0.000 0.000 | 0.140 |
1.000 0.857 | 1.000 |
||||||||
| Plot | Lyso | Other | |||||||||||
| Expt D |
5 peptides |
11 spectra |
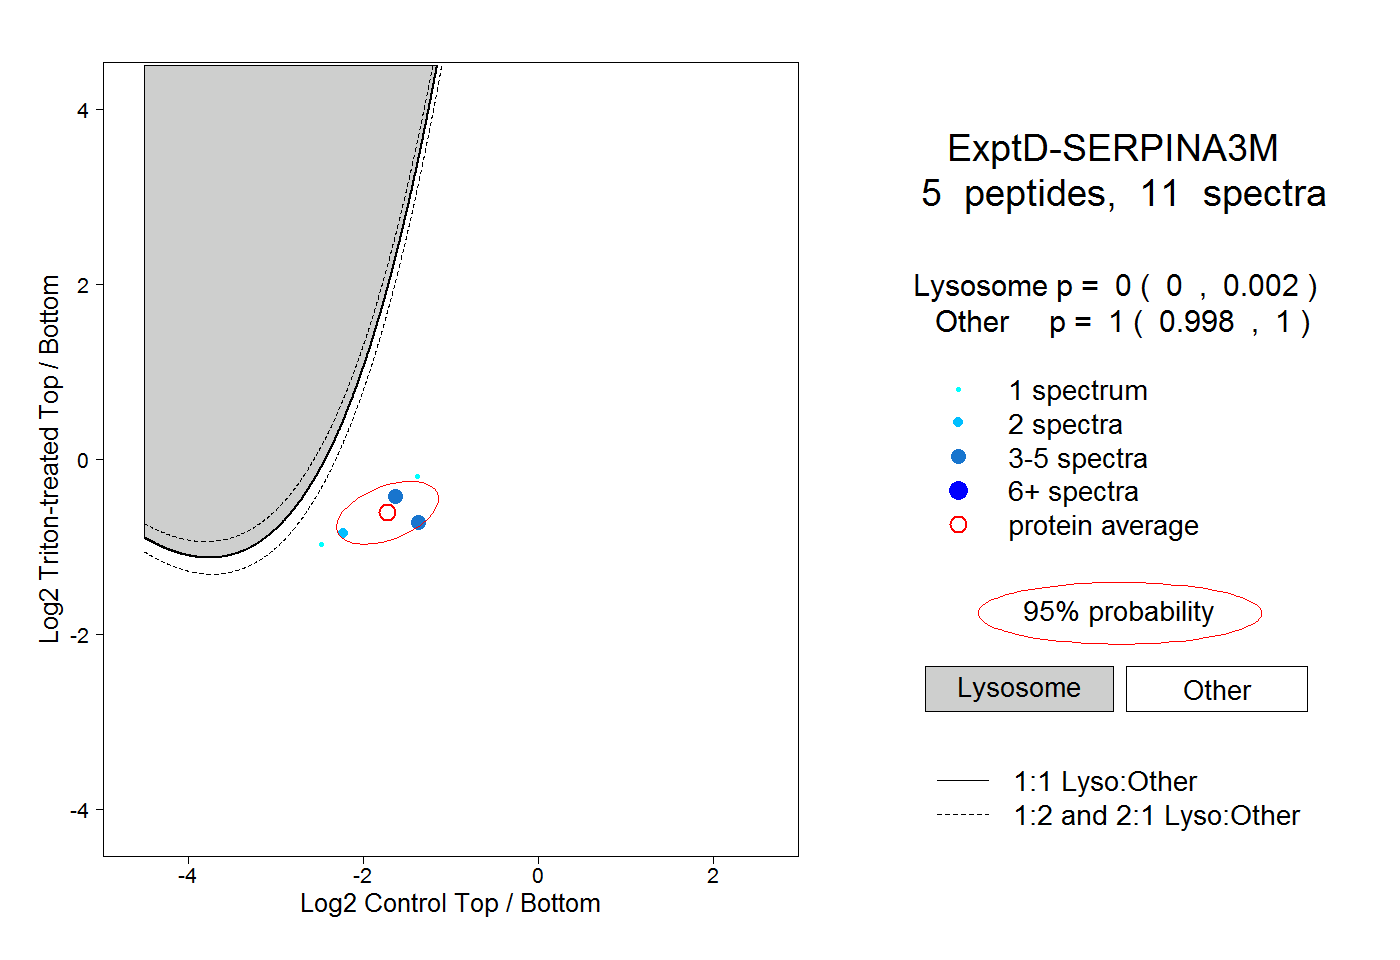 |
0.000 0.000 | 0.002 |
1.000 0.998 | 1.000 |