9
9peptides
spectra
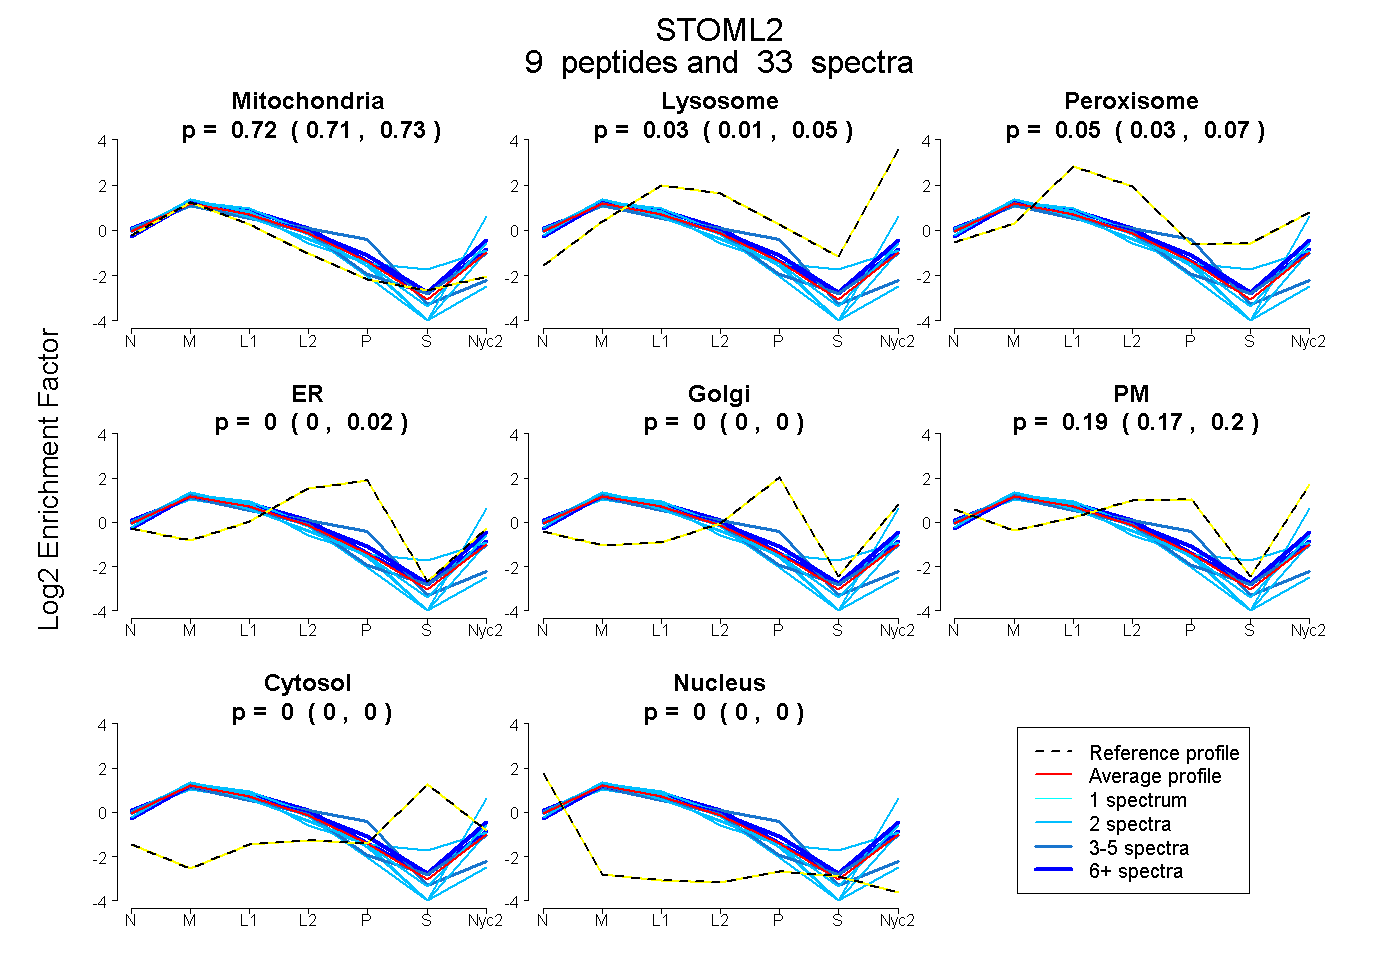
0.714 | 0.731
0.011 | 0.047
0.034 | 0.068
0.000 | 0.021
0.000 | 0.000
0.173 | 0.200
0.000 | 0.000
0.000 | 0.000
6peptides
spectra
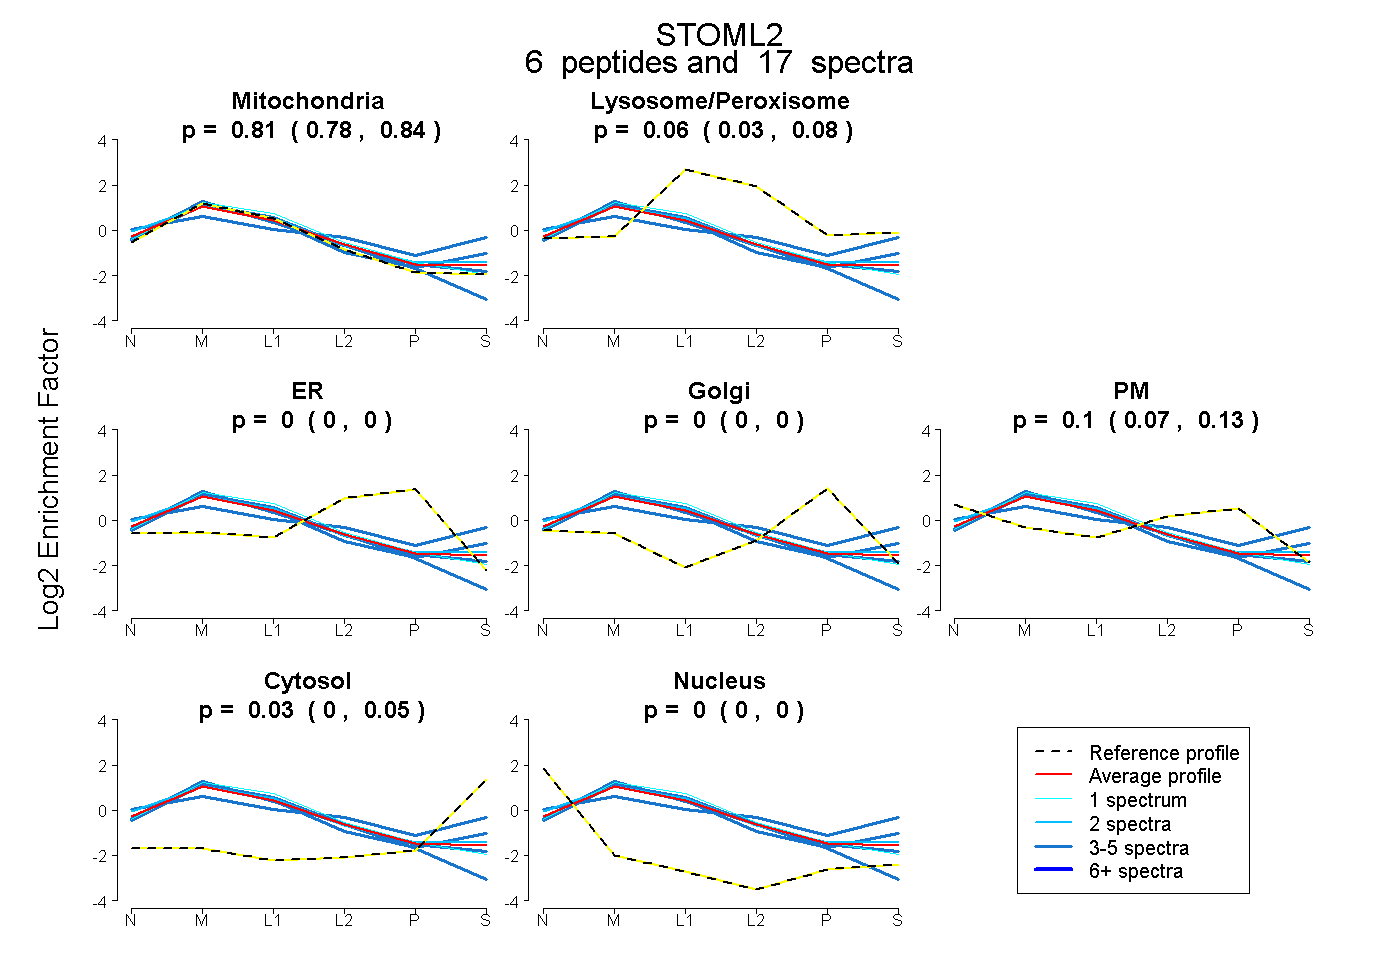
0.779 | 0.835
0.034 | 0.080
0.000 | 0.000
0.000 | 0.000
0.074 | 0.128
0.000 | 0.050
0.000 | 0.000