 9
9peptides
spectra
0.714 | 0.731
0.011 | 0.047
0.034 | 0.068
0.000 | 0.021
0.000 | 0.000
0.173 | 0.200
0.000 | 0.000
0.000 | 0.000
| Plot | Mito | Lyso | Perox | ER | Golgi | PM | Cytosol | Nucleus | |||||
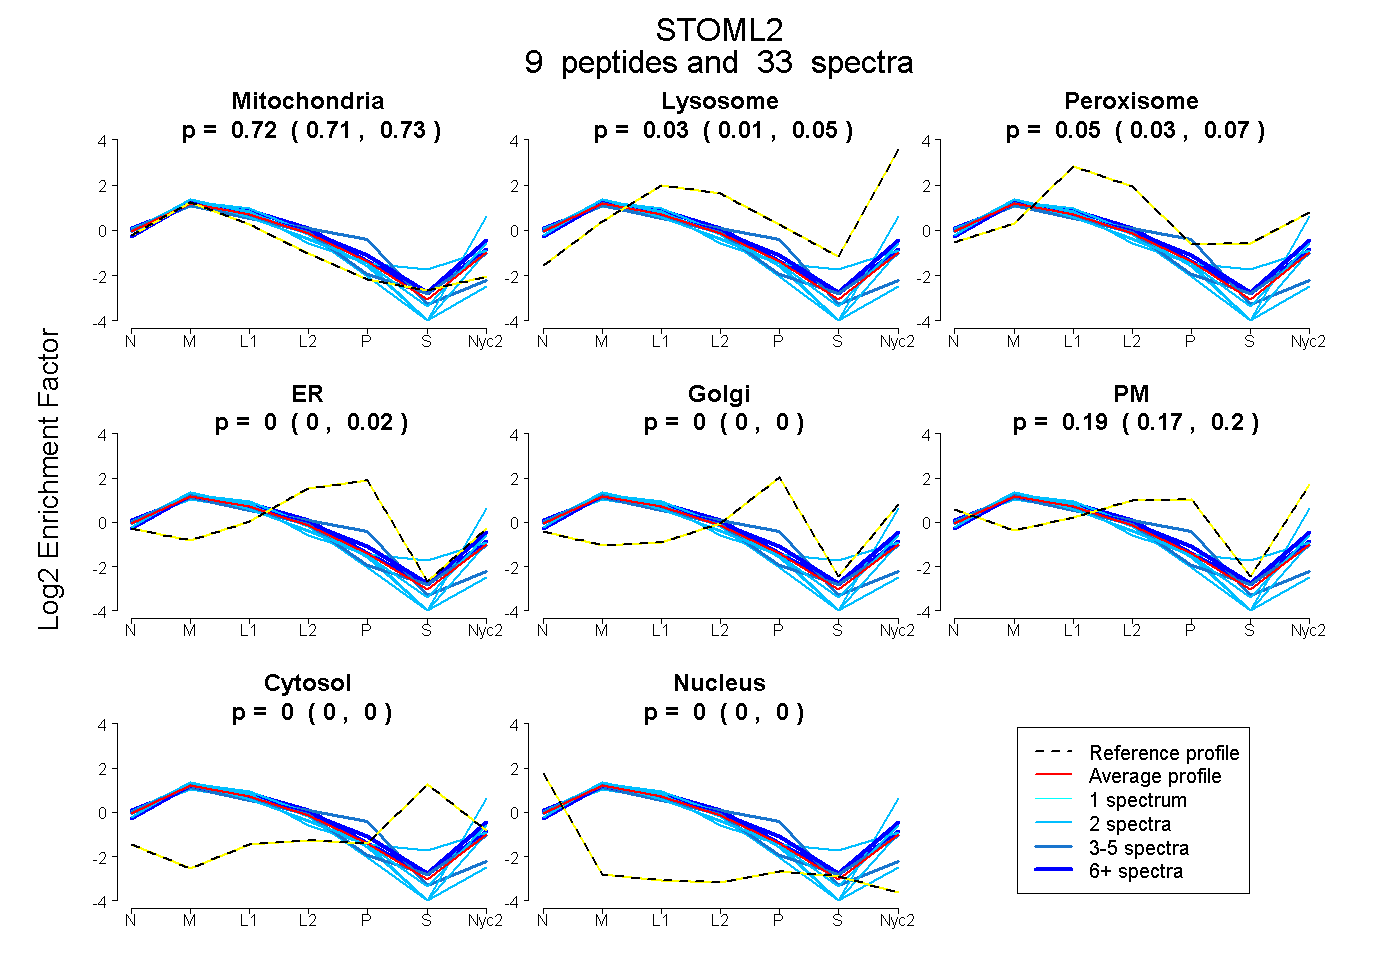
| Expt A |
9 peptides |
33 spectra |
|
0.723 0.714 | 0.731 |
0.026 0.011 | 0.047 |
0.055 0.034 | 0.068 |
0.002 0.000 | 0.021 |
0.000 0.000 | 0.000 |
0.194 0.173 | 0.200 |
0.000 0.000 | 0.000 |
0.000 0.000 | 0.000 |
| 6 spectra, ESMQMQVEAER | 0.657 | 0.157 | 0.000 | 0.006 | 0.000 | 0.180 | 0.000 | 0.000 | ||
| 2 spectra, ILEPGLNVLIPVLDR | 0.819 | 0.052 | 0.000 | 0.000 | 0.000 | 0.129 | 0.000 | 0.000 | ||
| 9 spectra, APVPGAQNSSEAR | 0.656 | 0.000 | 0.152 | 0.000 | 0.000 | 0.193 | 0.000 | 0.000 | ||
| 2 spectra, ESAINVAEGK | 0.902 | 0.000 | 0.000 | 0.098 | 0.000 | 0.000 | 0.000 | 0.000 | ||
| 2 spectra, DVQTTDTSIEELGR | 0.591 | 0.197 | 0.000 | 0.000 | 0.000 | 0.212 | 0.000 | 0.000 | ||
| 4 spectra, DIHVPPR | 0.677 | 0.000 | 0.000 | 0.323 | 0.000 | 0.000 | 0.000 | 0.000 | ||
| 4 spectra, QAQILASEAEK | 0.777 | 0.040 | 0.082 | 0.000 | 0.000 | 0.101 | 0.000 | 0.000 | ||
| 2 spectra, YVQSLK | 0.735 | 0.101 | 0.000 | 0.000 | 0.000 | 0.164 | 0.000 | 0.000 | ||
| 2 spectra, ATVLESEGTR | 0.650 | 0.000 | 0.198 | 0.000 | 0.000 | 0.108 | 0.044 | 0.000 |
| Plot | Mito | Lyso or Perox | ER | Golgi | PM | Cytosol | Nucleus | ||||||
| Expt B |
6 peptides |
17 spectra |
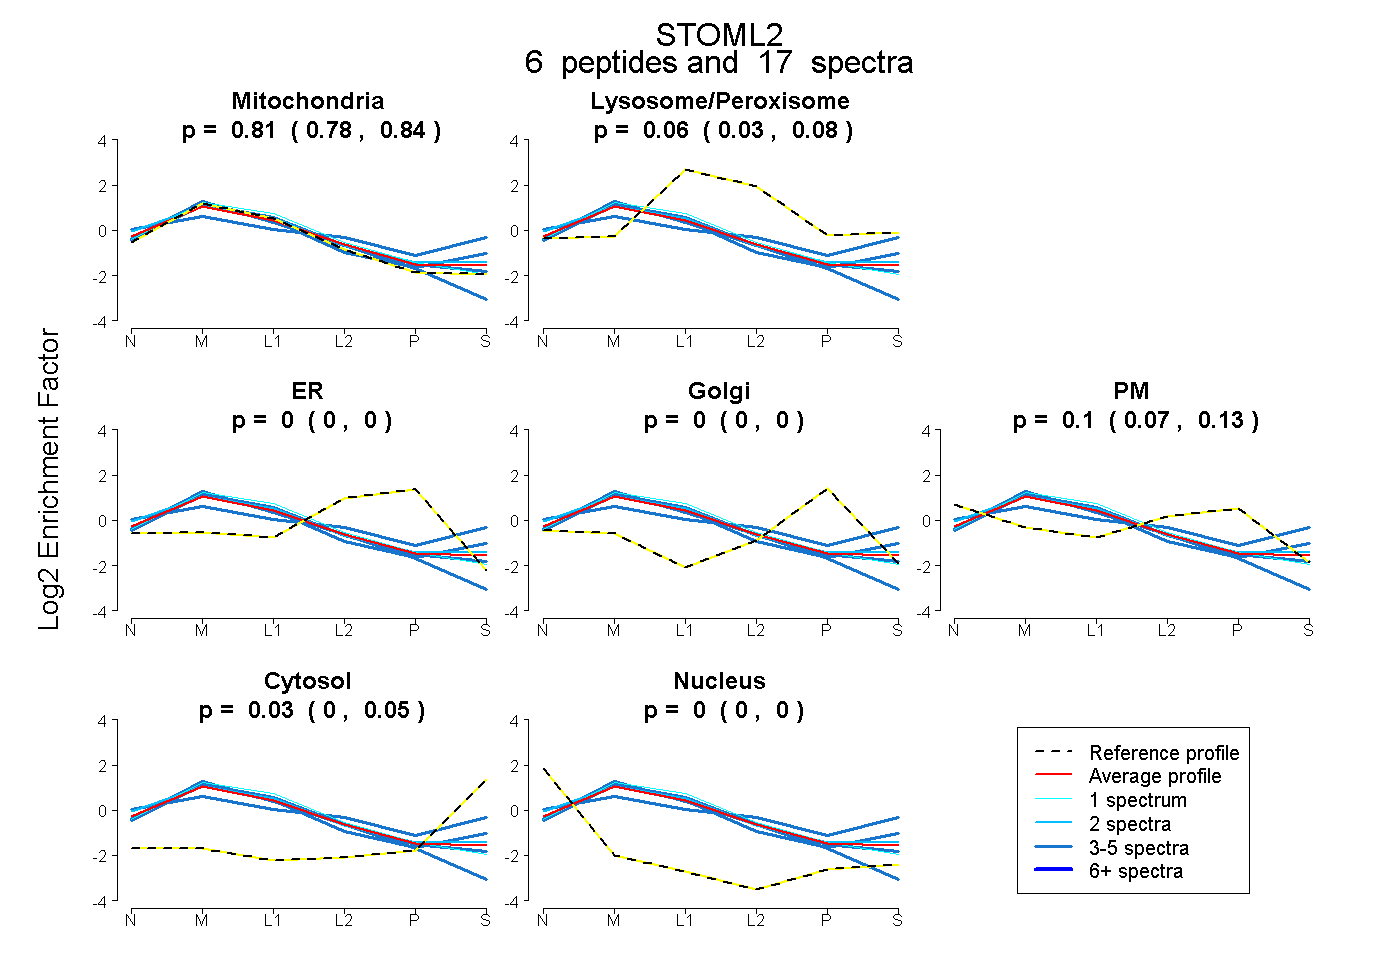 |
0.811 0.779 | 0.835 |
0.058 0.034 | 0.080 |
0.000 0.000 | 0.000 |
0.000 0.000 | 0.000 |
0.104 0.074 | 0.128 |
0.027 0.000 | 0.050 |
0.000 0.000 | 0.000 |
|||
| Plot | Lyso | Other | |||||||||||
| Expt C |
13 peptides |
255 spectra |
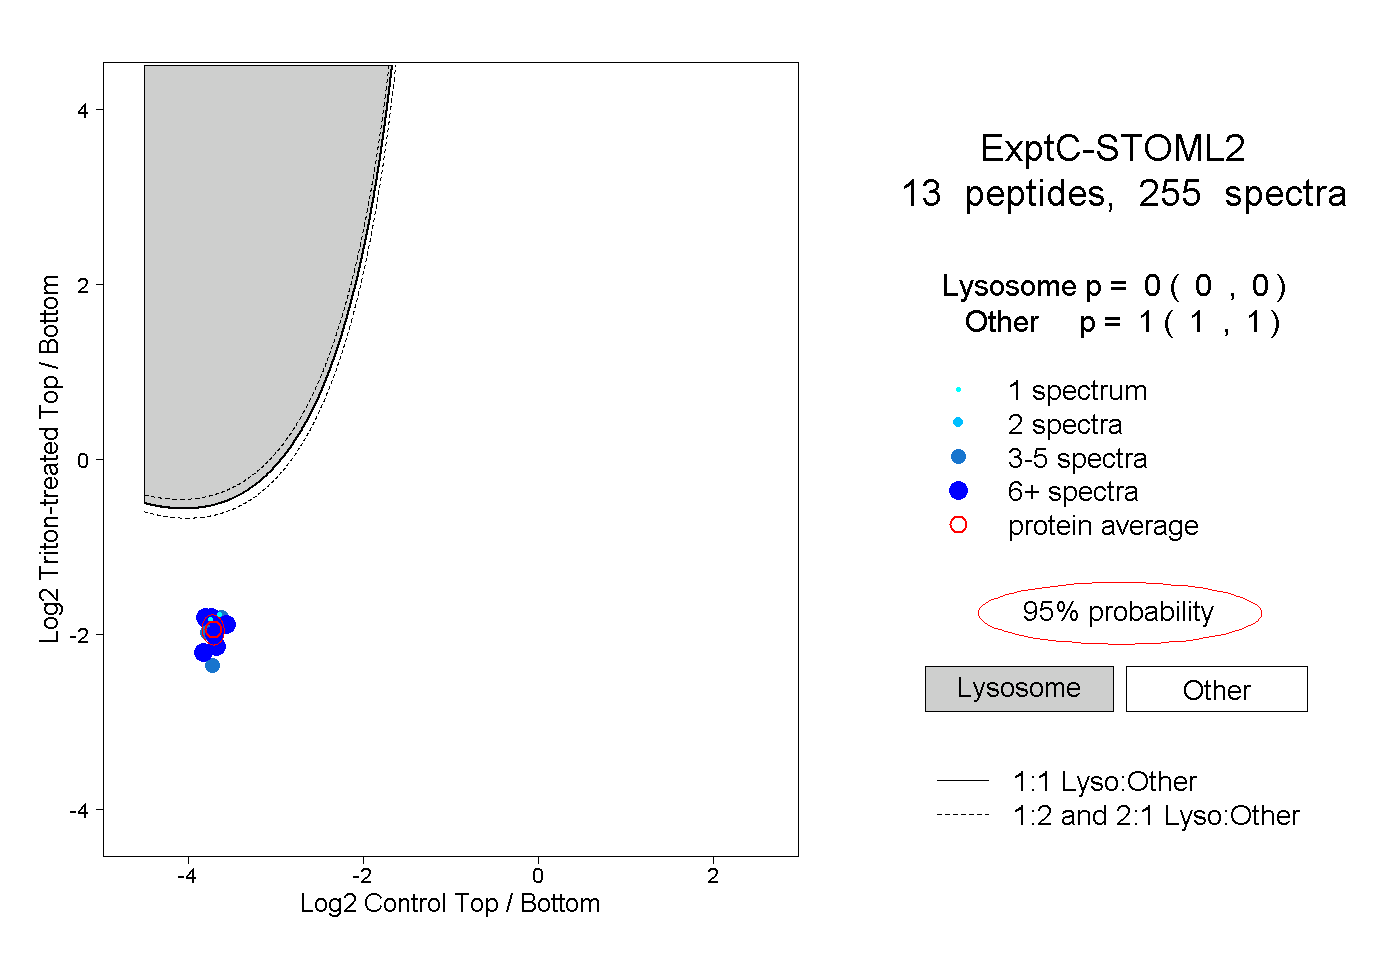 |
0.000 0.000 | 0.000 |
1.000 1.000 | 1.000 |
||||||||
| Plot | Lyso | Other | |||||||||||
| Expt D |
9 peptides |
29 spectra |
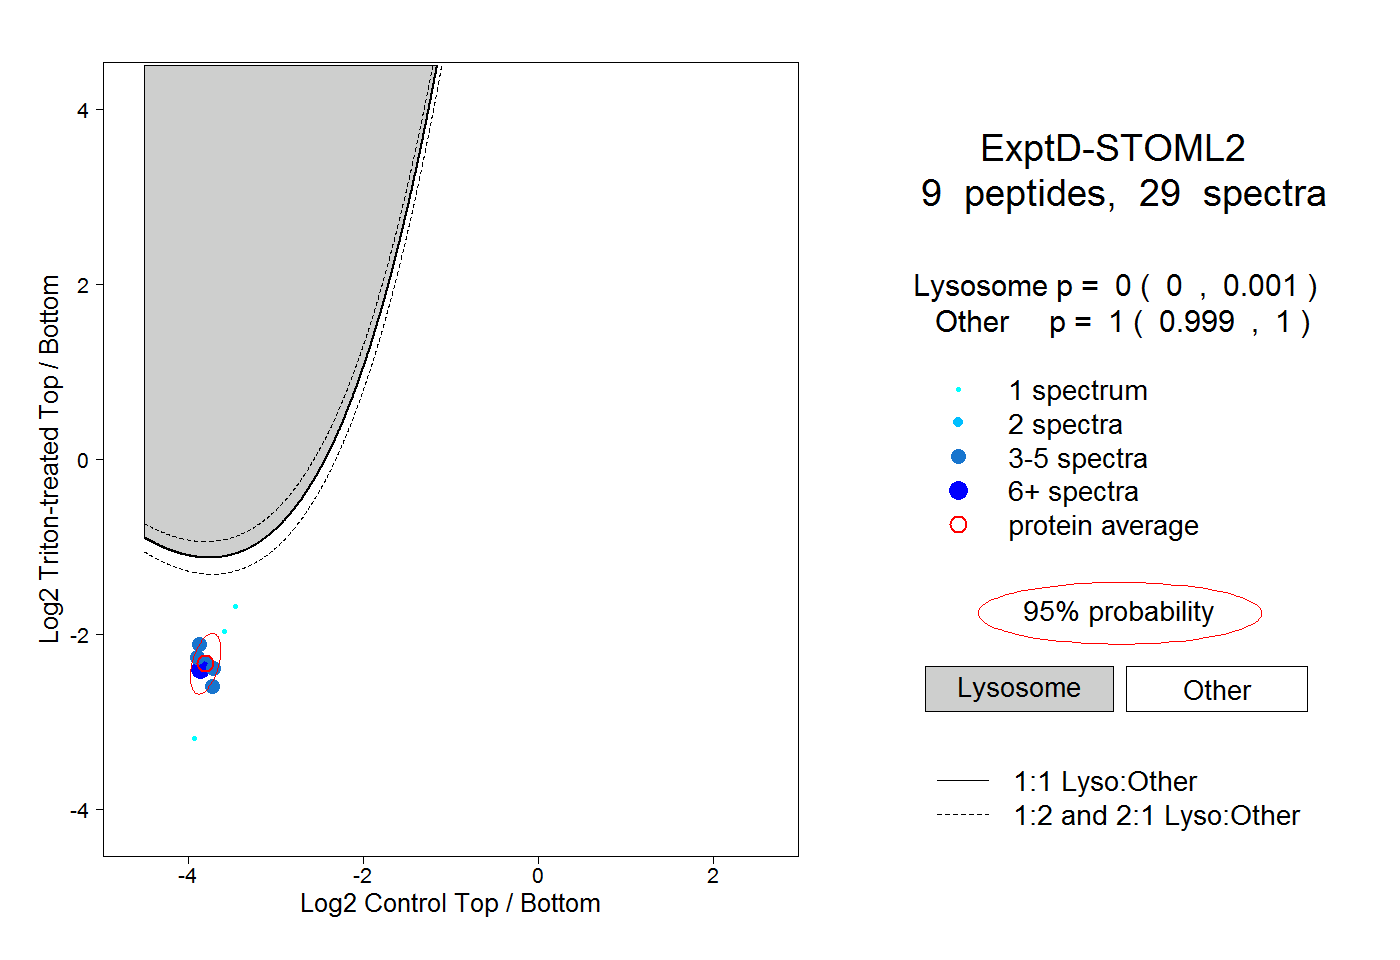 |
0.000 0.000 | 0.001 |
1.000 0.999 | 1.000 |