 5
5peptides
spectra
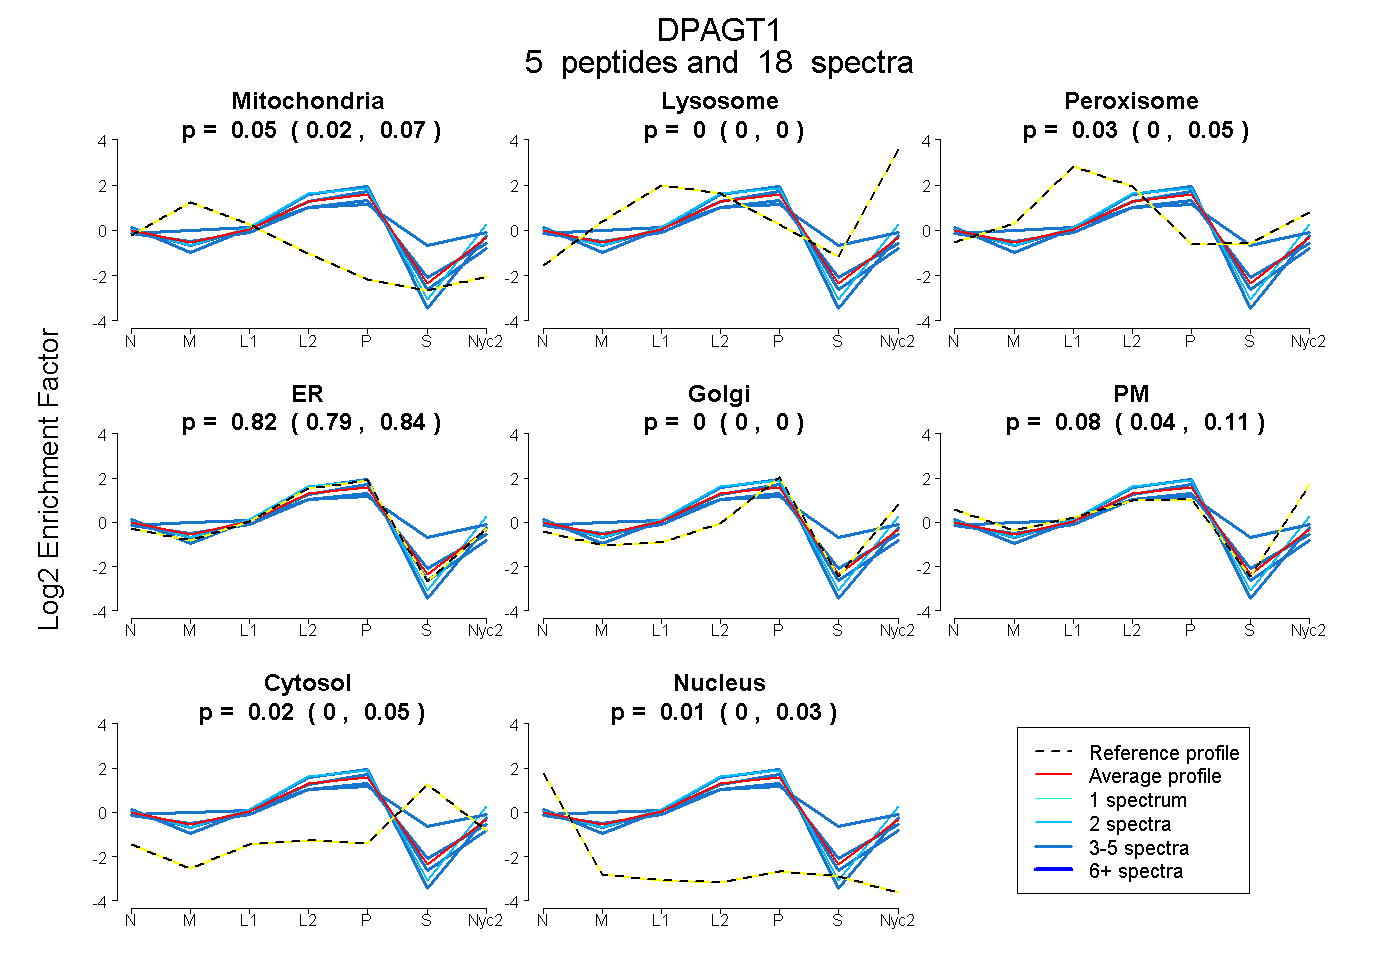
0.016 | 0.072
0.000 | 0.000
0.000 | 0.053
0.785 | 0.845
0.000 | 0.000
0.043 | 0.108
0.000 | 0.046
0.000 | 0.026
3peptides
spectra
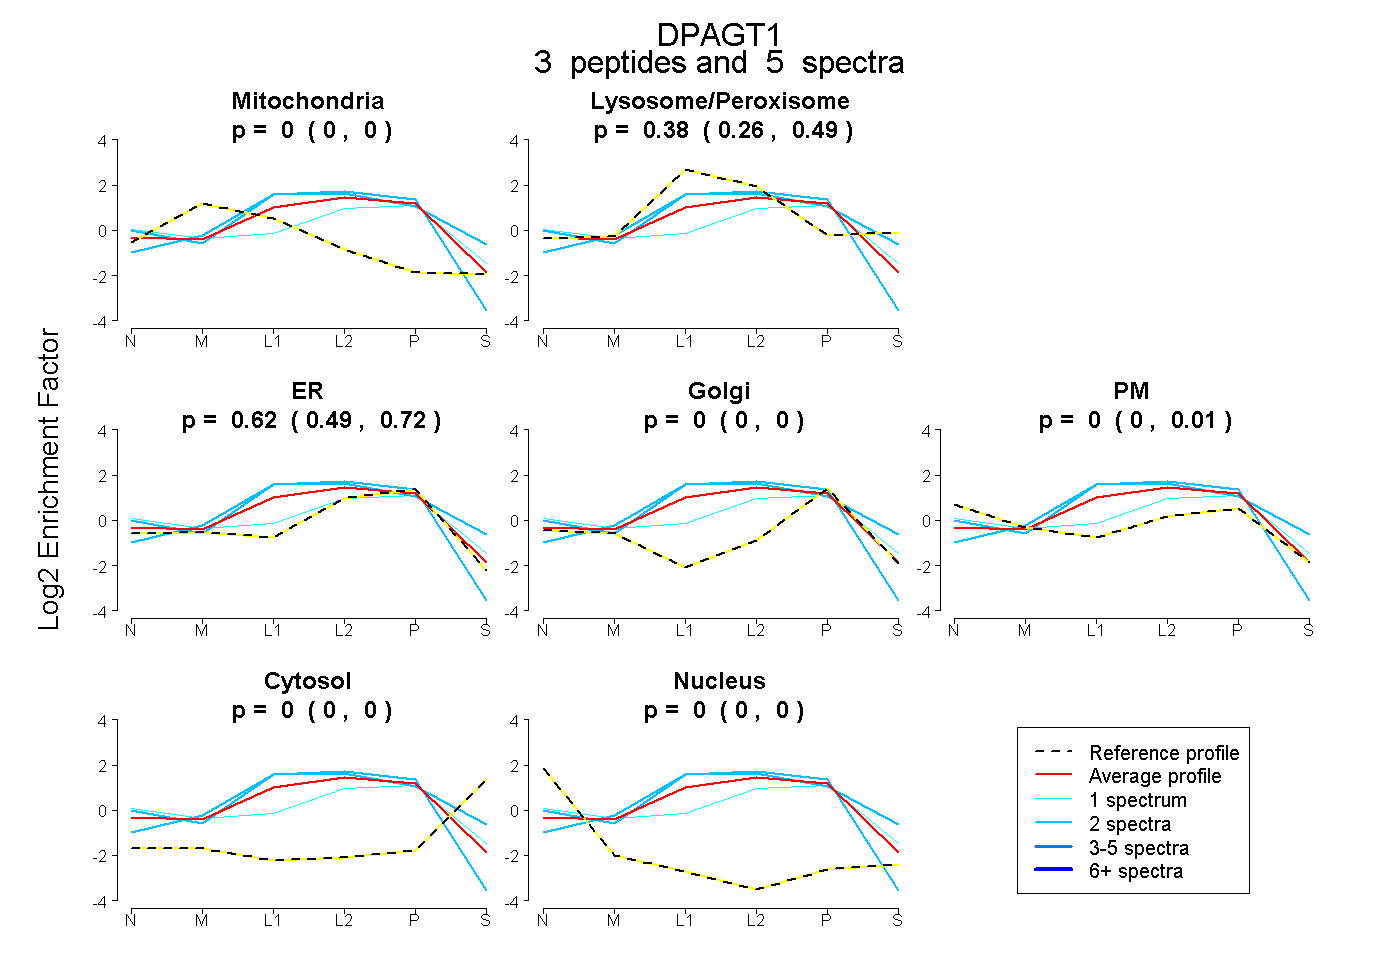
0.000 | 0.000
0.261 | 0.486
0.491 | 0.717
0.000 | 0.000
0.000 | 0.008
0.000 | 0.000
0.000 | 0.000
5peptides
spectra
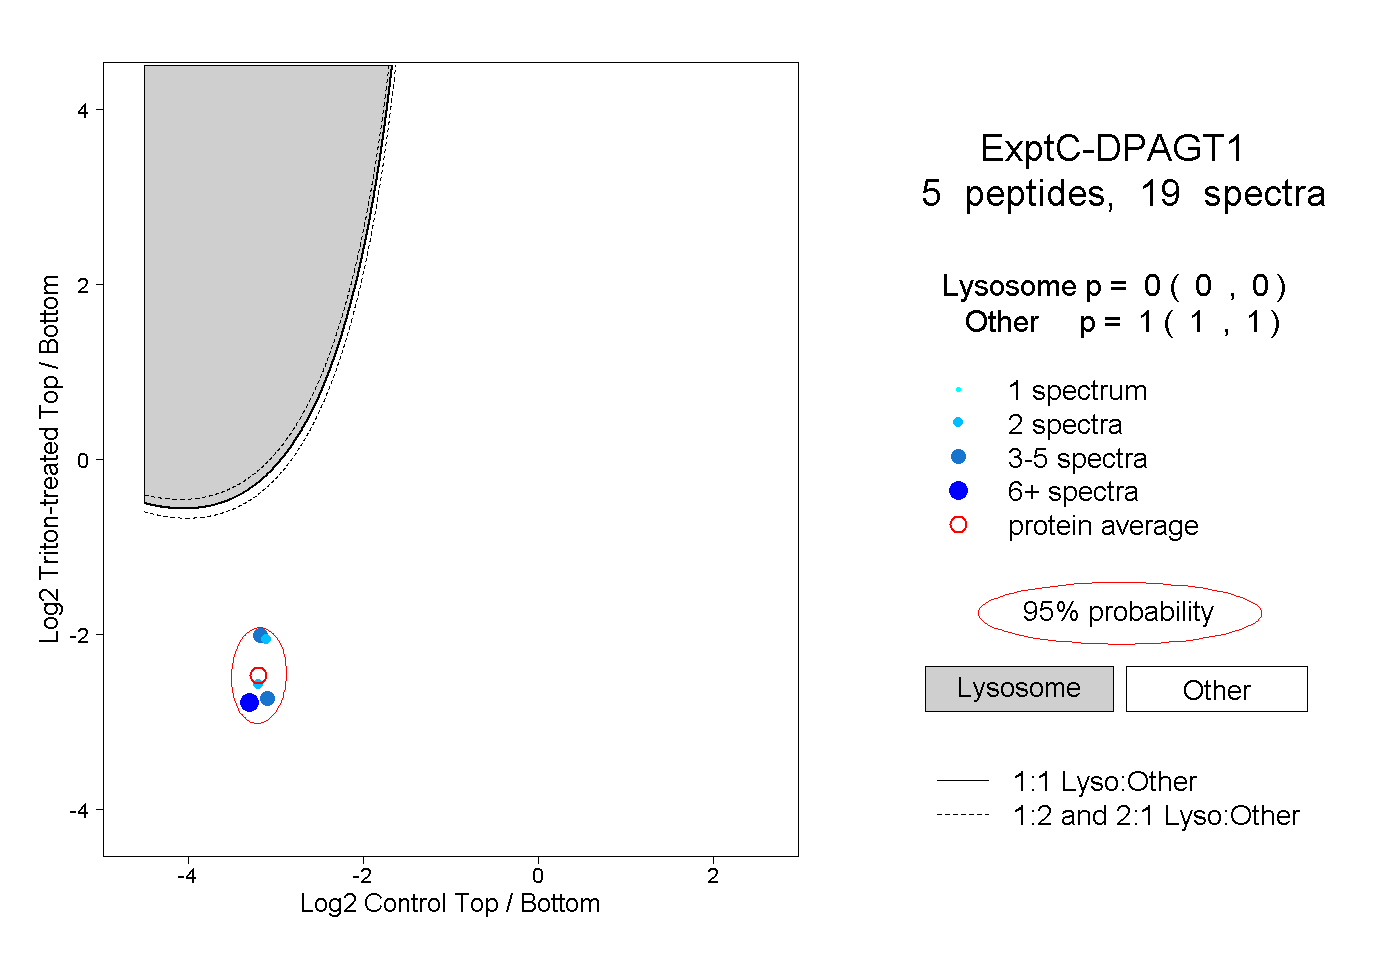
0.000 | 0.000
1.000 | 1.000
1peptide
spectra
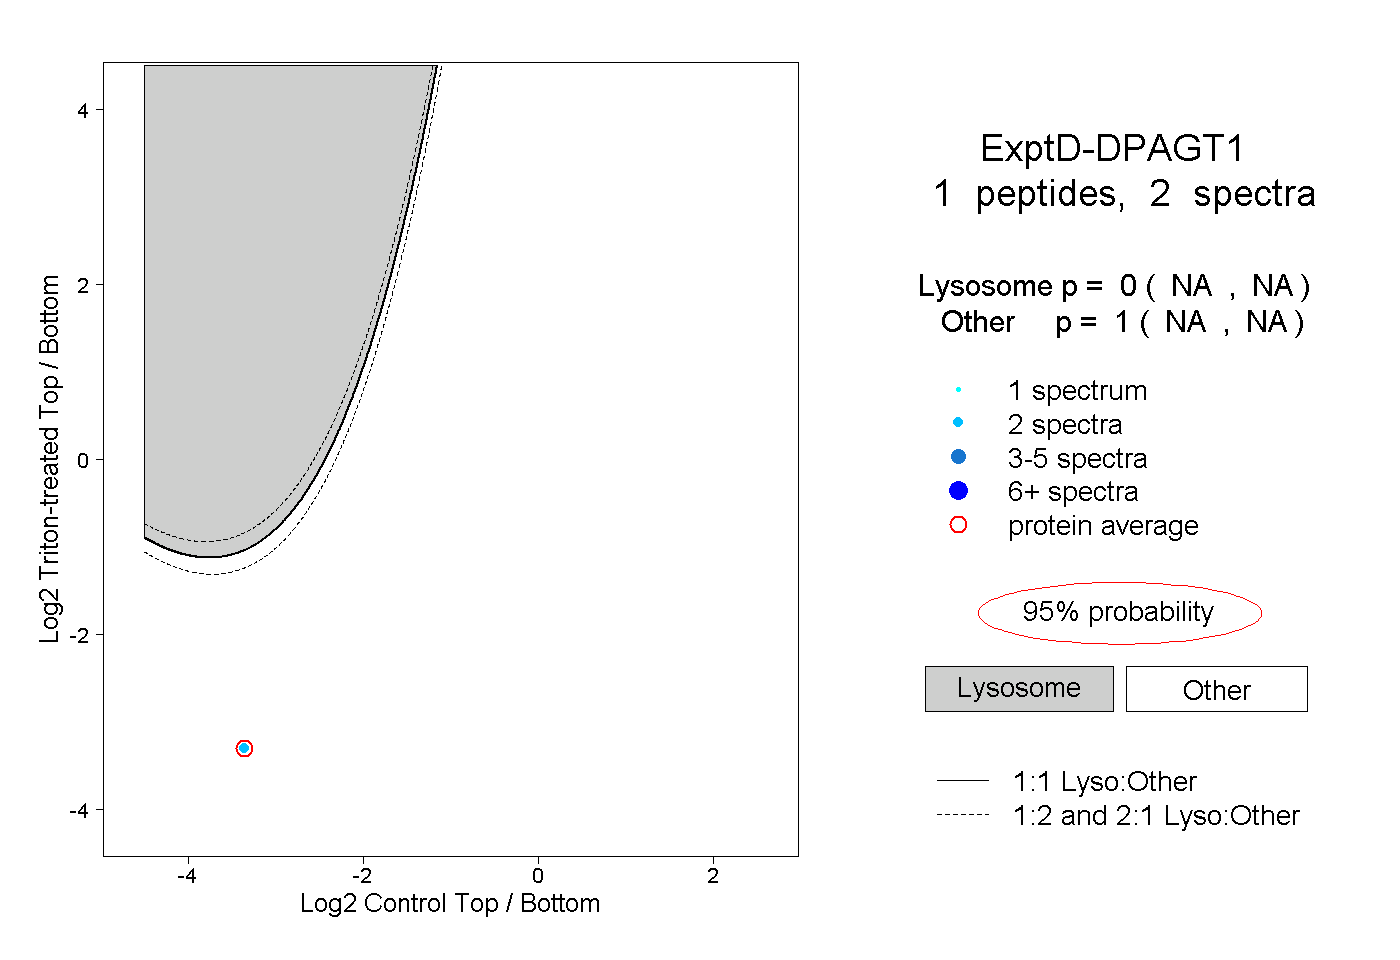
NA | NA
NA | NA