 6
6peptides
spectra
0.000 | 0.000
0.000 | 0.000
0.000 | 0.000
0.433 | 0.454
0.000 | 0.000
0.000 | 0.000
0.314 | 0.345
0.199 | 0.245
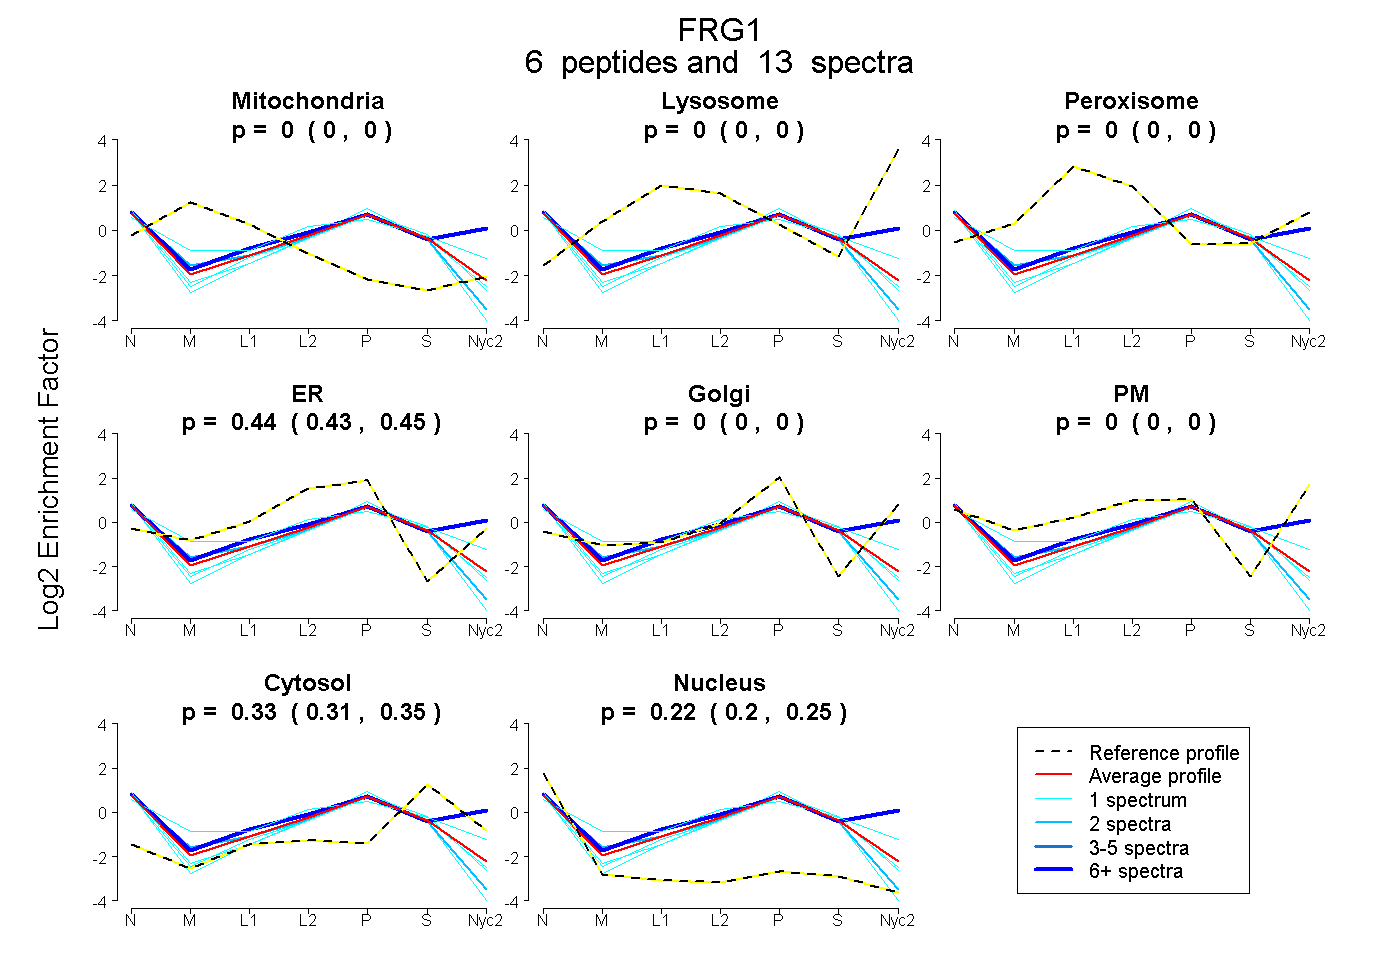
| Plot | Mito | Lyso | Perox | ER | Golgi | PM | Cytosol | Nucleus | |||||
| Expt A |
6 peptides |
13 spectra |
|
0.000 0.000 | 0.000 |
0.000 0.000 | 0.000 |
0.000 0.000 | 0.000 |
0.444 0.433 | 0.454 |
0.000 0.000 | 0.000 |
0.000 0.000 | 0.000 |
0.331 0.314 | 0.345 |
0.224 0.199 | 0.245 |
| 1 spectrum, YLGINSDGLVVGR | 0.000 | 0.000 | 0.000 | 0.390 | 0.000 | 0.000 | 0.332 | 0.277 | ||
| 1 spectrum, EQWEPVFQDGK | 0.000 | 0.000 | 0.000 | 0.383 | 0.000 | 0.000 | 0.359 | 0.257 | ||
| 1 spectrum, TAGEEEMIK | 0.000 | 0.000 | 0.088 | 0.446 | 0.000 | 0.000 | 0.338 | 0.128 | ||
| 2 spectra, MALLASNSCFIR | 0.000 | 0.000 | 0.000 | 0.428 | 0.000 | 0.000 | 0.255 | 0.317 | ||
| 1 spectrum, EVDEGPSPPEQFTAVK | 0.000 | 0.000 | 0.000 | 0.371 | 0.000 | 0.000 | 0.257 | 0.372 | ||
| 7 spectra, SDAIGPR | 0.000 | 0.000 | 0.000 | 0.078 | 0.073 | 0.415 | 0.373 | 0.061 |
| Plot | Mito | Lyso or Perox | ER | Golgi | PM | Cytosol | Nucleus | ||||||
| Expt B |
1 peptide |
1 spectrum |
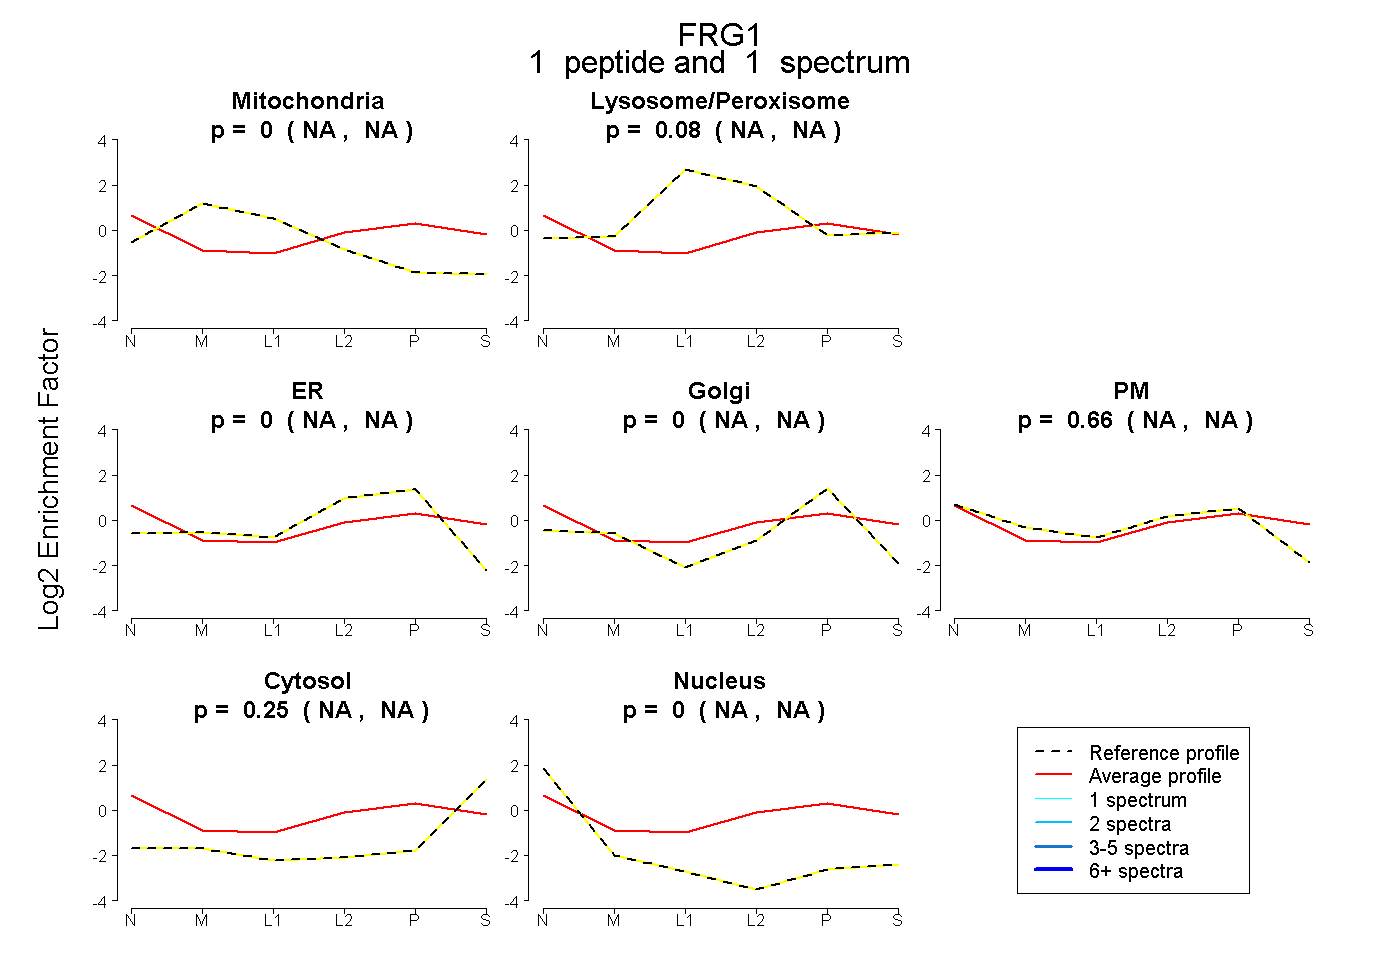 |
0.000 NA | NA |
0.084 NA | NA |
0.000 NA | NA |
0.000 NA | NA |
0.664 NA | NA |
0.252 NA | NA |
0.000 NA | NA |
|||
| Plot | Lyso | Other | |||||||||||
| Expt C |
2 peptides |
4 spectra |
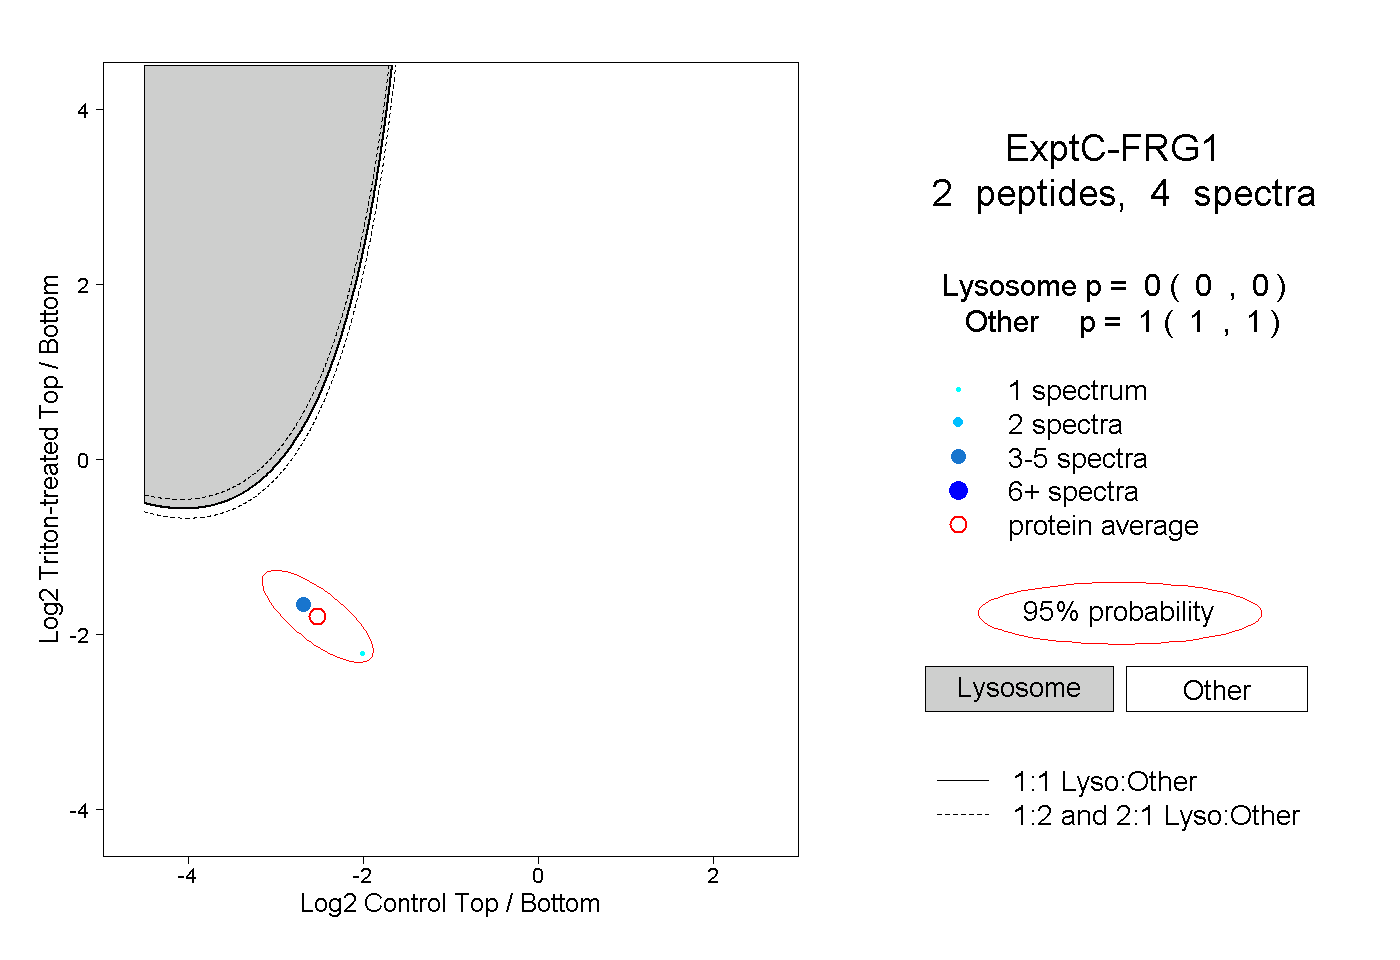 |
0.000 0.000 | 0.000 |
1.000 1.000 | 1.000 |