13
13peptides
spectra
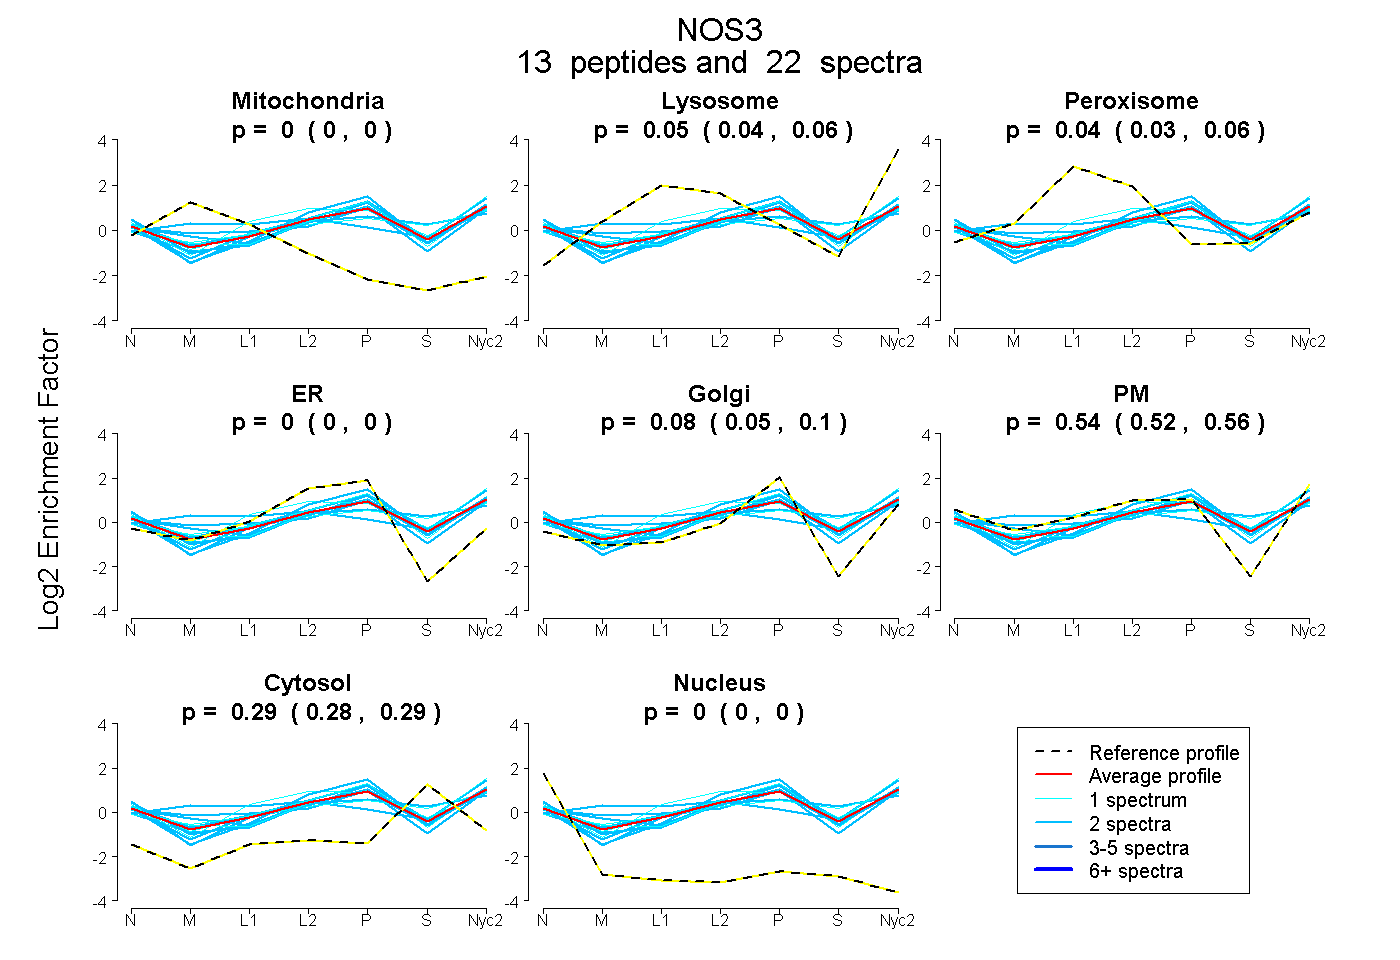
0.000 | 0.000
0.040 | 0.056
0.031 | 0.055
0.000 | 0.000
0.055 | 0.095
0.520 | 0.565
0.275 | 0.293
0.000 | 0.000
4peptides
spectra
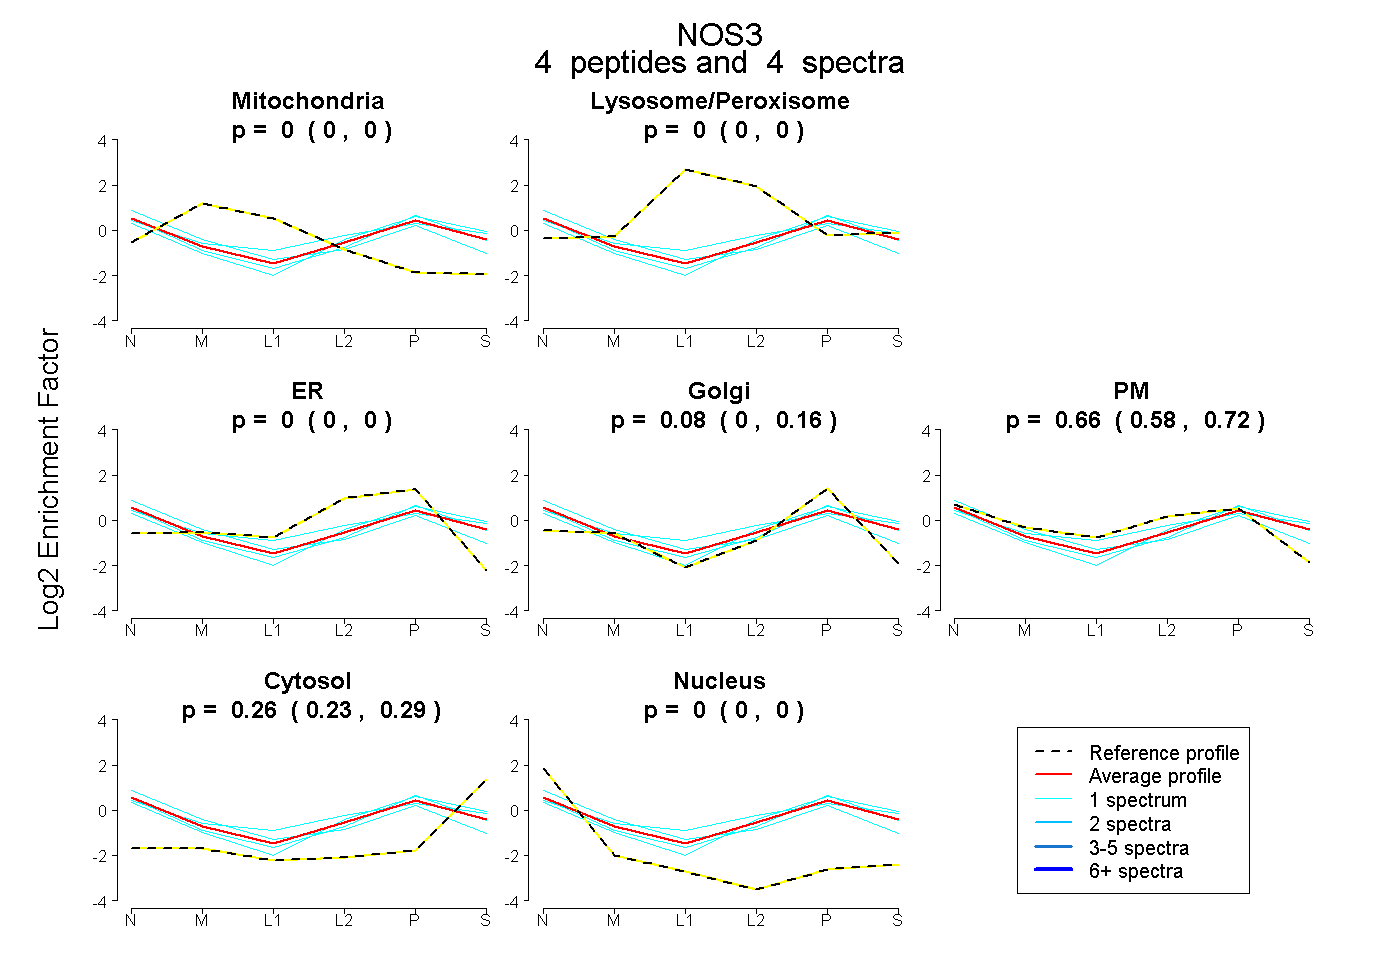
0.000 | 0.000
0.000 | 0.000
0.000 | 0.000
0.000 | 0.155
0.576 | 0.719
0.229 | 0.286
0.000 | 0.003
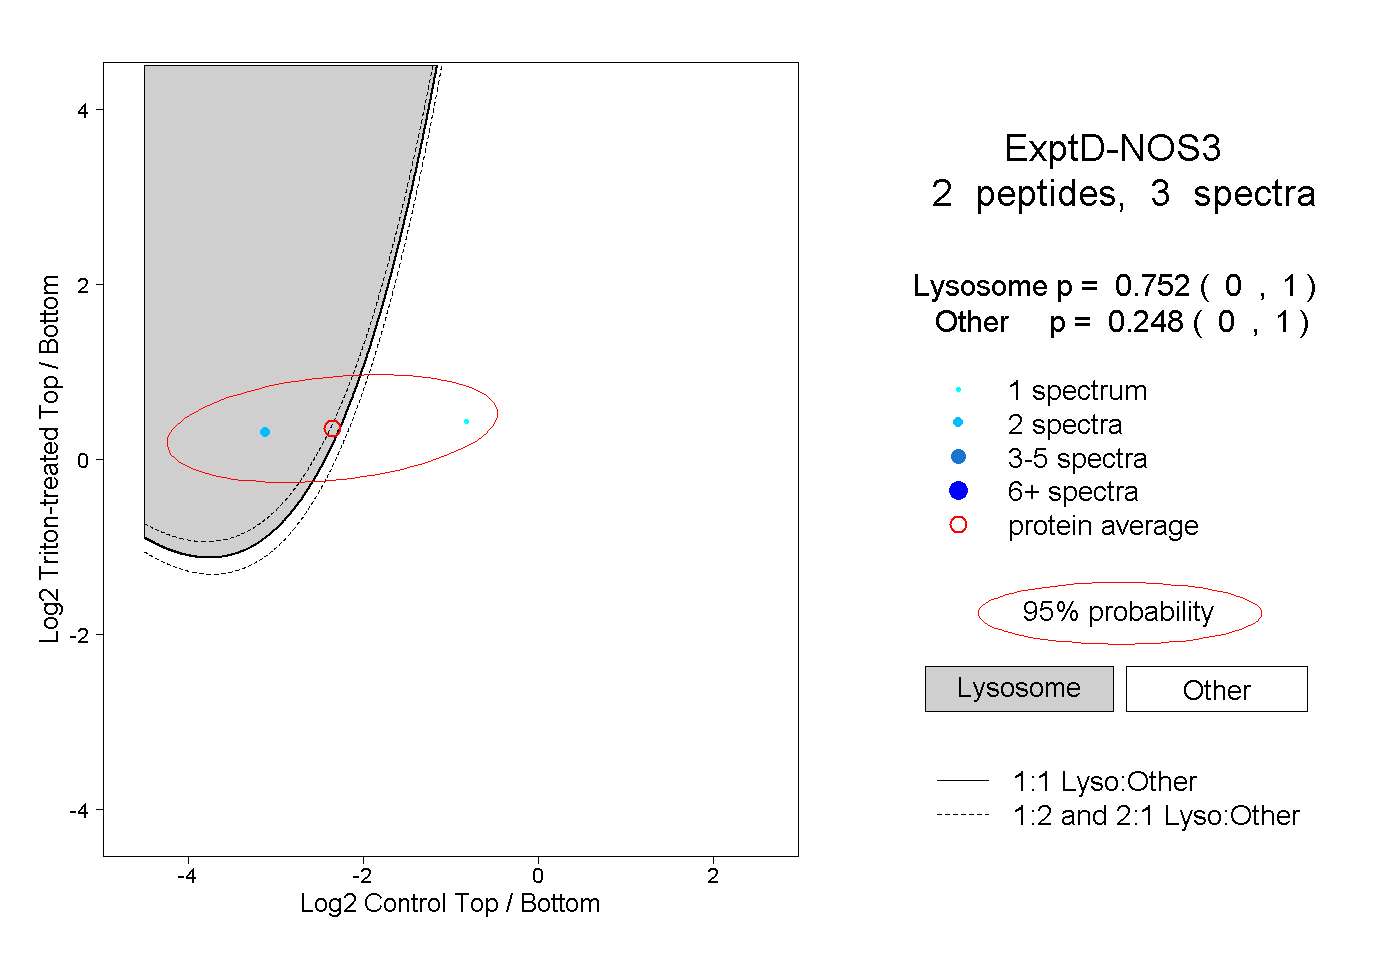
19peptides
spectra
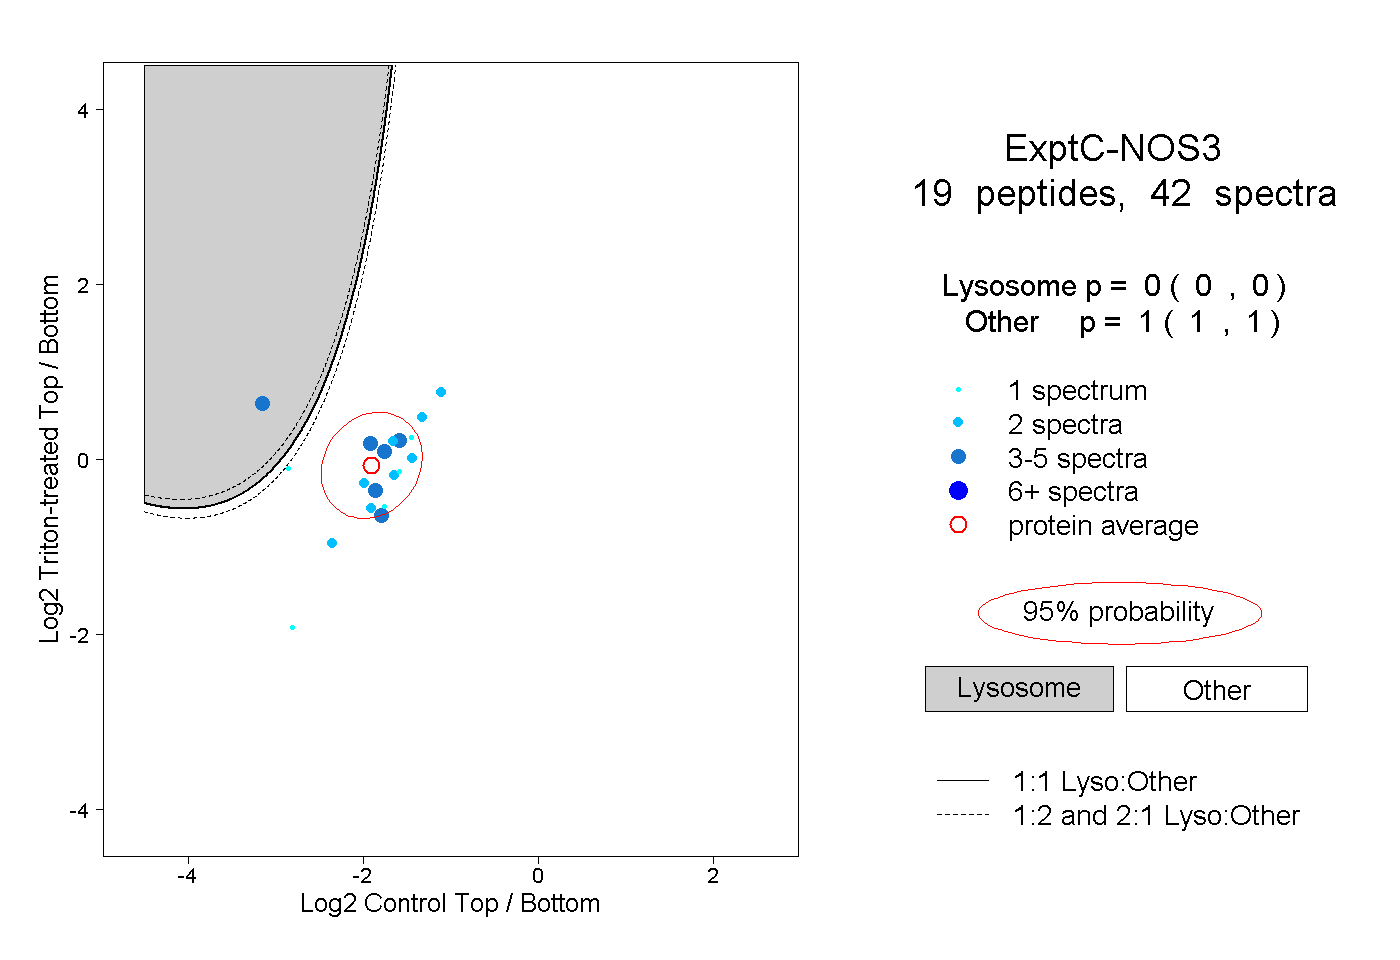
0.000 | 0.000
1.000 | 1.000