 13
13peptides
spectra
0.000 | 0.000
0.040 | 0.056
0.031 | 0.055
0.000 | 0.000
0.055 | 0.095
0.520 | 0.565
0.275 | 0.293
0.000 | 0.000
| Plot | Mito | Lyso | Perox | ER | Golgi | PM | Cytosol | Nucleus | |||||
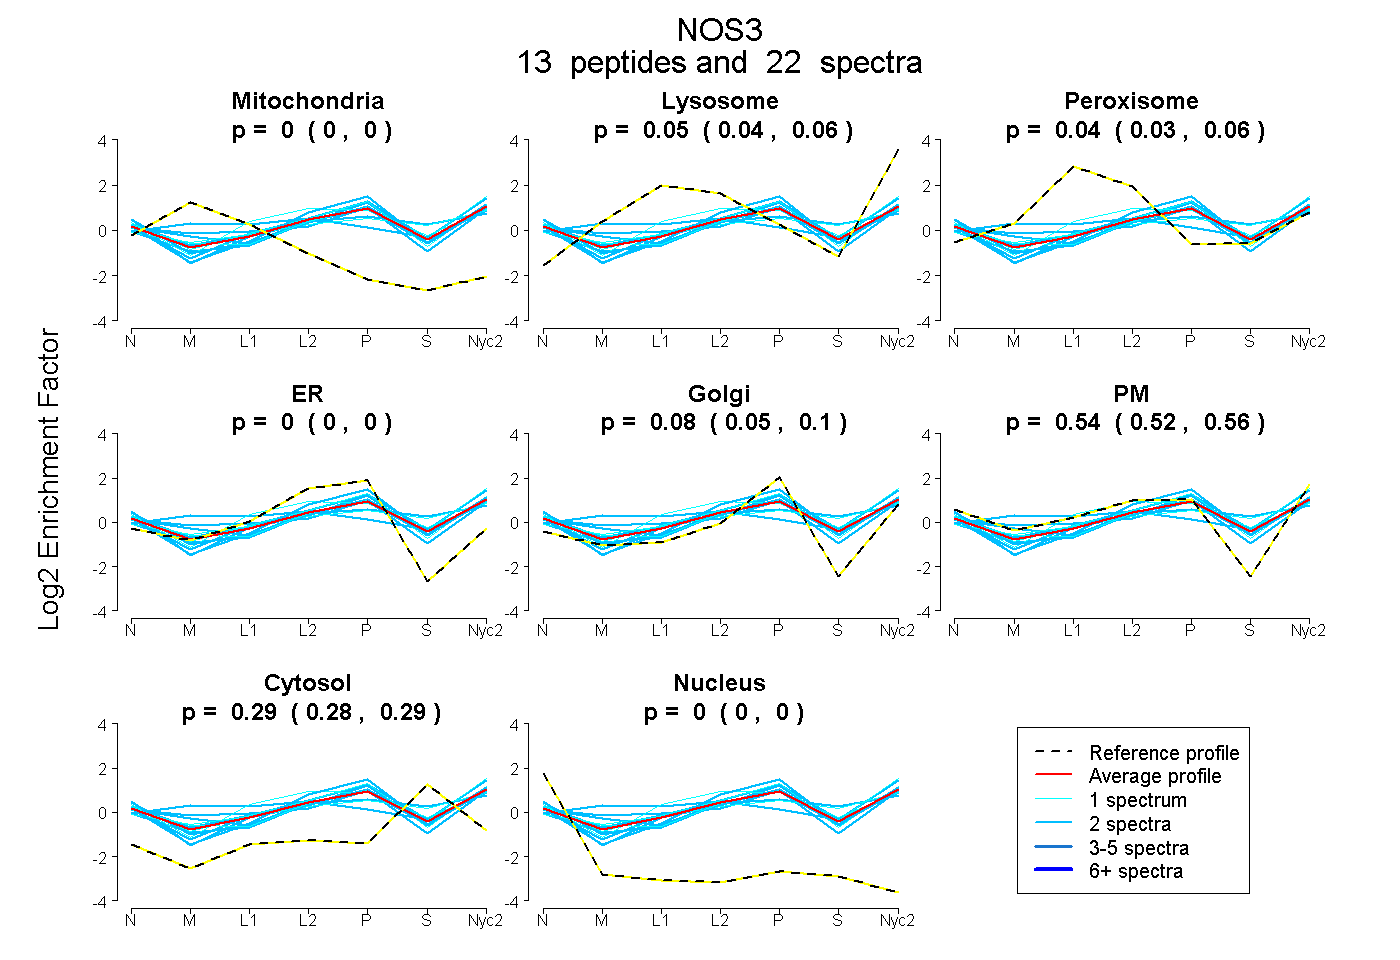
| Expt A |
13 peptides |
22 spectra |
|
0.000 0.000 | 0.000 |
0.048 0.040 | 0.056 |
0.044 0.031 | 0.055 |
0.000 0.000 | 0.000 |
0.077 0.055 | 0.095 |
0.545 0.520 | 0.565 |
0.285 0.275 | 0.293 |
0.000 0.000 | 0.000 |
| 1 spectrum, LQSRPTQGPSPTEQLLGQAR | 0.000 | 0.040 | 0.057 | 0.000 | 0.197 | 0.505 | 0.201 | 0.000 | ||
| 1 spectrum, LQEVEAEVVATGTYQLR | 0.000 | 0.103 | 0.097 | 0.000 | 0.023 | 0.393 | 0.384 | 0.000 | ||
| 2 spectra, ESSNTDSAGALGTLR | 0.047 | 0.244 | 0.120 | 0.000 | 0.000 | 0.359 | 0.230 | 0.000 | ||
| 1 spectrum, HLENEQK | 0.000 | 0.000 | 0.205 | 0.049 | 0.000 | 0.490 | 0.255 | 0.000 | ||
| 2 spectra, CLGSLVFPR | 0.000 | 0.058 | 0.012 | 0.000 | 0.000 | 0.491 | 0.438 | 0.000 | ||
| 2 spectra, TQSFSLQER | 0.000 | 0.032 | 0.000 | 0.128 | 0.183 | 0.409 | 0.248 | 0.000 | ||
| 2 spectra, ATILYGSETGR | 0.003 | 0.012 | 0.147 | 0.000 | 0.255 | 0.418 | 0.165 | 0.000 | ||
| 2 spectra, AQSYAQQLGR | 0.000 | 0.000 | 0.113 | 0.002 | 0.242 | 0.385 | 0.257 | 0.000 | ||
| 2 spectra, GTGITR | 0.000 | 0.012 | 0.087 | 0.000 | 0.095 | 0.538 | 0.268 | 0.000 | ||
| 2 spectra, GVFGQVLTAFSR | 0.000 | 0.000 | 0.000 | 0.000 | 0.119 | 0.603 | 0.279 | 0.000 | ||
| 2 spectra, SAITVFPQR | 0.000 | 0.000 | 0.000 | 0.000 | 0.075 | 0.637 | 0.287 | 0.000 | ||
| 2 spectra, LHDIEIK | 0.000 | 0.062 | 0.000 | 0.000 | 0.099 | 0.573 | 0.266 | 0.000 | ||
| 1 spectrum, VEDPPPSTEPVAVEQLEK | 0.000 | 0.116 | 0.000 | 0.000 | 0.117 | 0.498 | 0.269 | 0.000 |
| Plot | Mito | Lyso or Perox | ER | Golgi | PM | Cytosol | Nucleus | ||||||
| Expt B |
4 peptides |
4 spectra |
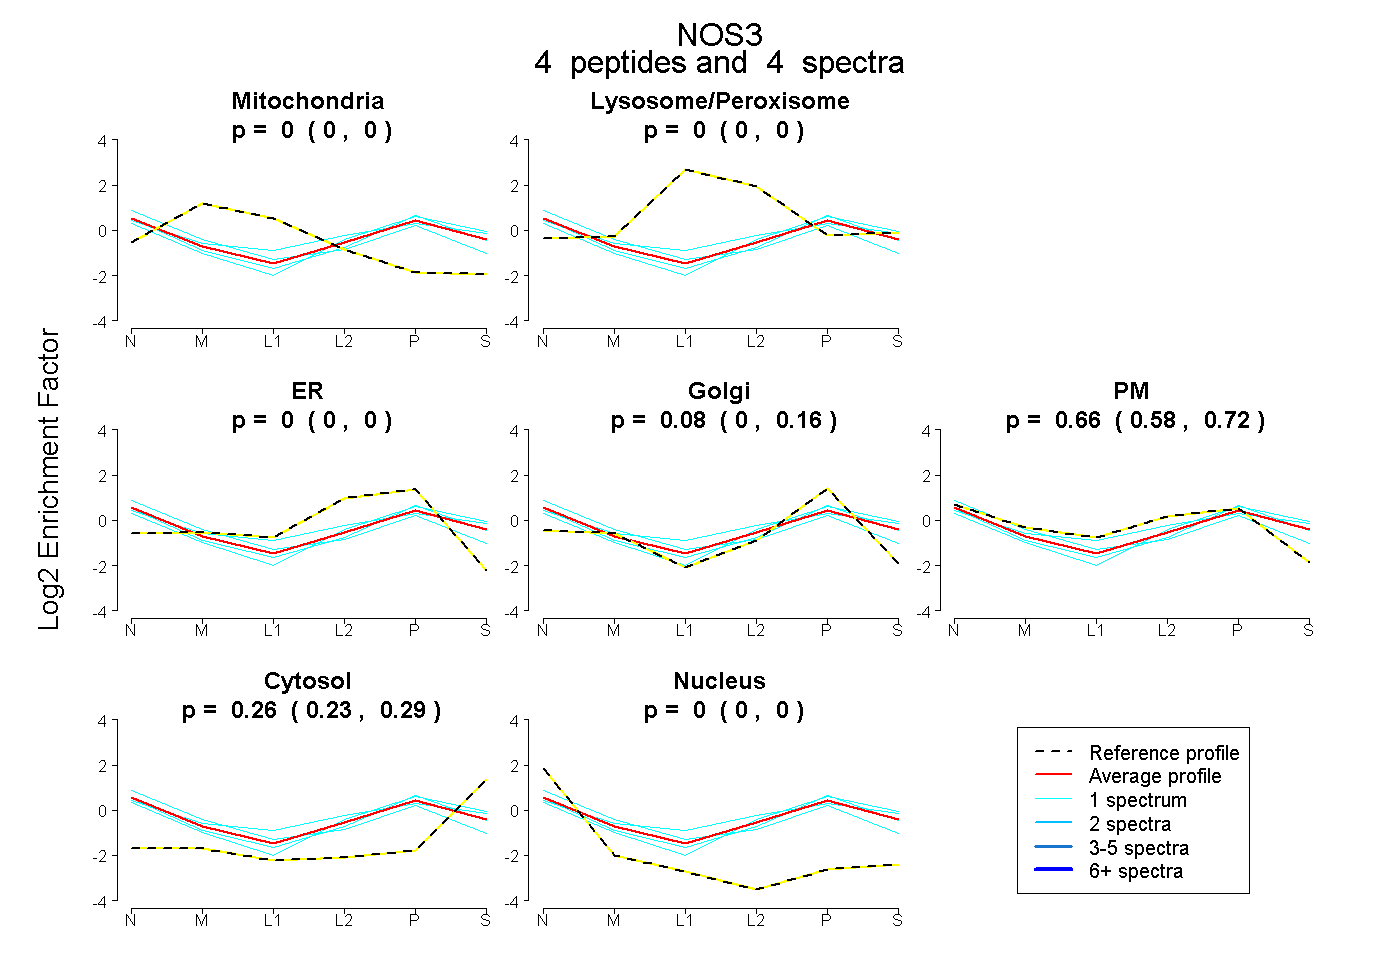 |
0.000 0.000 | 0.000 |
0.000 0.000 | 0.000 |
0.000 0.000 | 0.000 |
0.083 0.000 | 0.155 |
0.655 0.576 | 0.719 |
0.262 0.229 | 0.286 |
0.000 0.000 | 0.003 |
|||
| Plot | Lyso | Other | |||||||||||
| Expt C |
19 peptides |
42 spectra |
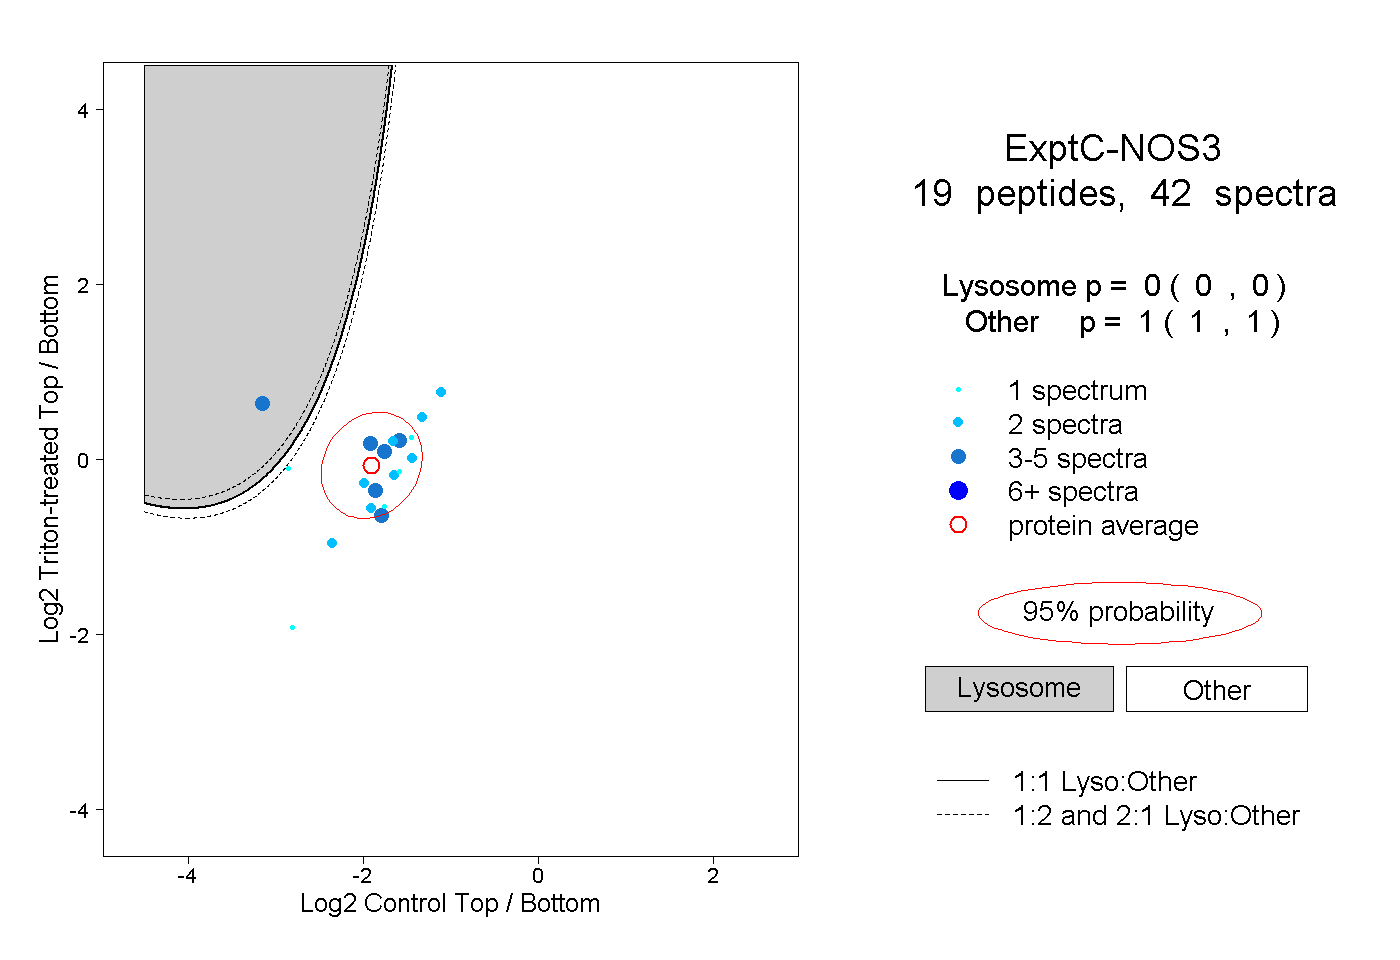 |
0.000 0.000 | 0.000 |
1.000 1.000 | 1.000 |
||||||||
| Plot | Lyso | Other | |||||||||||
| Expt D |
2 peptides |
3 spectra |
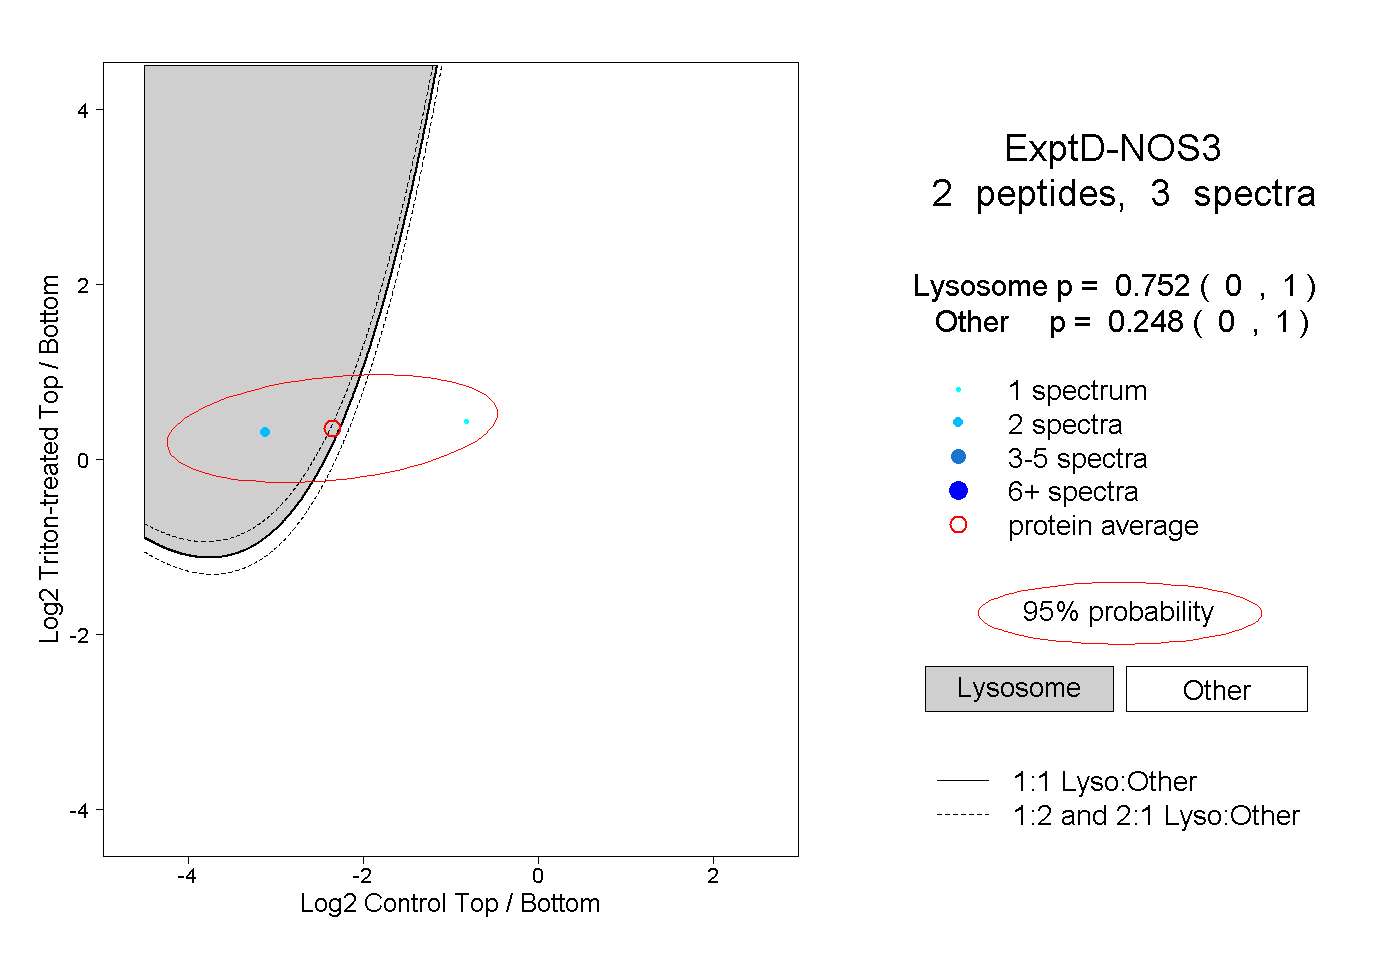 |
0.752 0.000 | 1.000 |
0.248 0.000 | 1.000 |