 9
9peptides
spectra
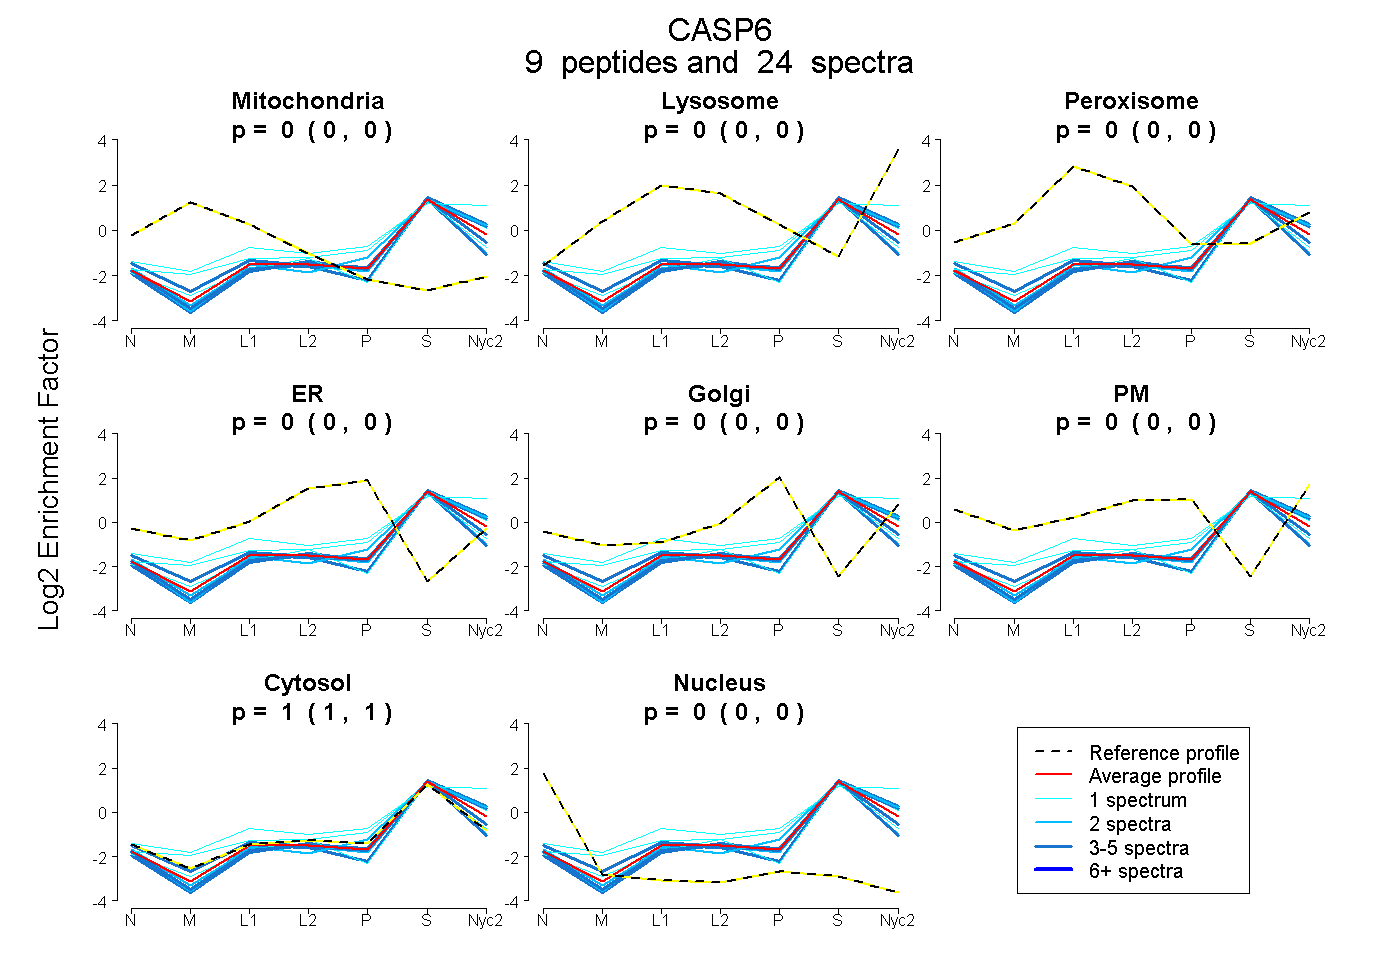
0.000 | 0.000
0.000 | 0.000
0.000 | 0.000
0.000 | 0.000
0.000 | 0.000
0.000 | 0.000
1.000 | 1.000
0.000 | 0.000
| Plot | Mito | Lyso | Perox | ER | Golgi | PM | Cytosol | Nucleus | |||||
| Expt A |
9 peptides |
24 spectra |
|
0.000 0.000 | 0.000 |
0.000 0.000 | 0.000 |
0.000 0.000 | 0.000 |
0.000 0.000 | 0.000 |
0.000 0.000 | 0.000 |
0.000 0.000 | 0.000 |
1.000 1.000 | 1.000 |
0.000 0.000 | 0.000 |
| 2 spectra, EVLDPAEQYK | 0.000 | 0.000 | 0.000 | 0.000 | 0.000 | 0.000 | 0.982 | 0.018 | ||
| 1 spectrum, LHFCPKPSK | 0.004 | 0.050 | 0.000 | 0.000 | 0.026 | 0.000 | 0.920 | 0.000 | ||
| 4 spectra, AEELILK | 0.000 | 0.000 | 0.000 | 0.000 | 0.000 | 0.000 | 1.000 | 0.000 | ||
| 5 spectra, FFWHLALPER | 0.000 | 0.000 | 0.000 | 0.000 | 0.000 | 0.000 | 1.000 | 0.000 | ||
| 1 spectrum, FSELGFEVK | 0.000 | 0.003 | 0.000 | 0.000 | 0.000 | 0.000 | 0.997 | 0.000 | ||
| 1 spectrum, QVPCFASMLTK | 0.000 | 0.264 | 0.000 | 0.000 | 0.000 | 0.000 | 0.736 | 0.000 | ||
| 3 spectra, GTALIFNHER | 0.000 | 0.047 | 0.000 | 0.000 | 0.000 | 0.000 | 0.953 | 0.000 | ||
| 2 spectra, IEIQTLTGLFK | 0.000 | 0.000 | 0.000 | 0.000 | 0.000 | 0.000 | 1.000 | 0.000 | ||
| 5 spectra, LFIIQACR | 0.000 | 0.000 | 0.000 | 0.000 | 0.000 | 0.000 | 0.989 | 0.011 |
| Plot | Mito | Lyso or Perox | ER | Golgi | PM | Cytosol | Nucleus | ||||||
| Expt B |
1 peptide |
1 spectrum |
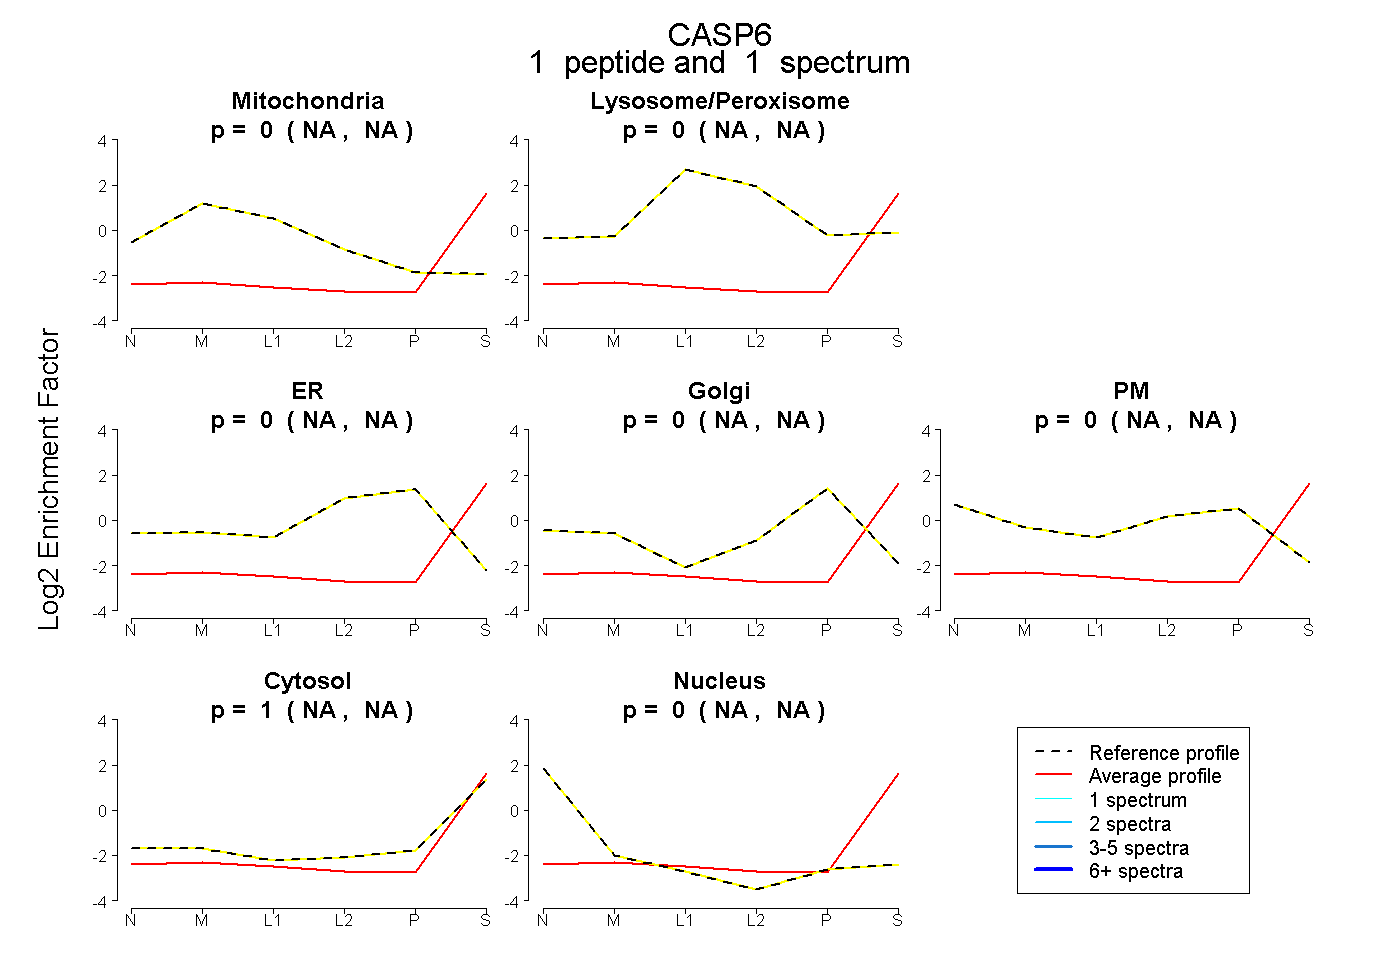 |
0.000 NA | NA |
0.000 NA | NA |
0.000 NA | NA |
0.000 NA | NA |
0.000 NA | NA |
1.000 NA | NA |
0.000 NA | NA |
|||
| Plot | Lyso | Other | |||||||||||
| Expt C |
5 peptides |
13 spectra |
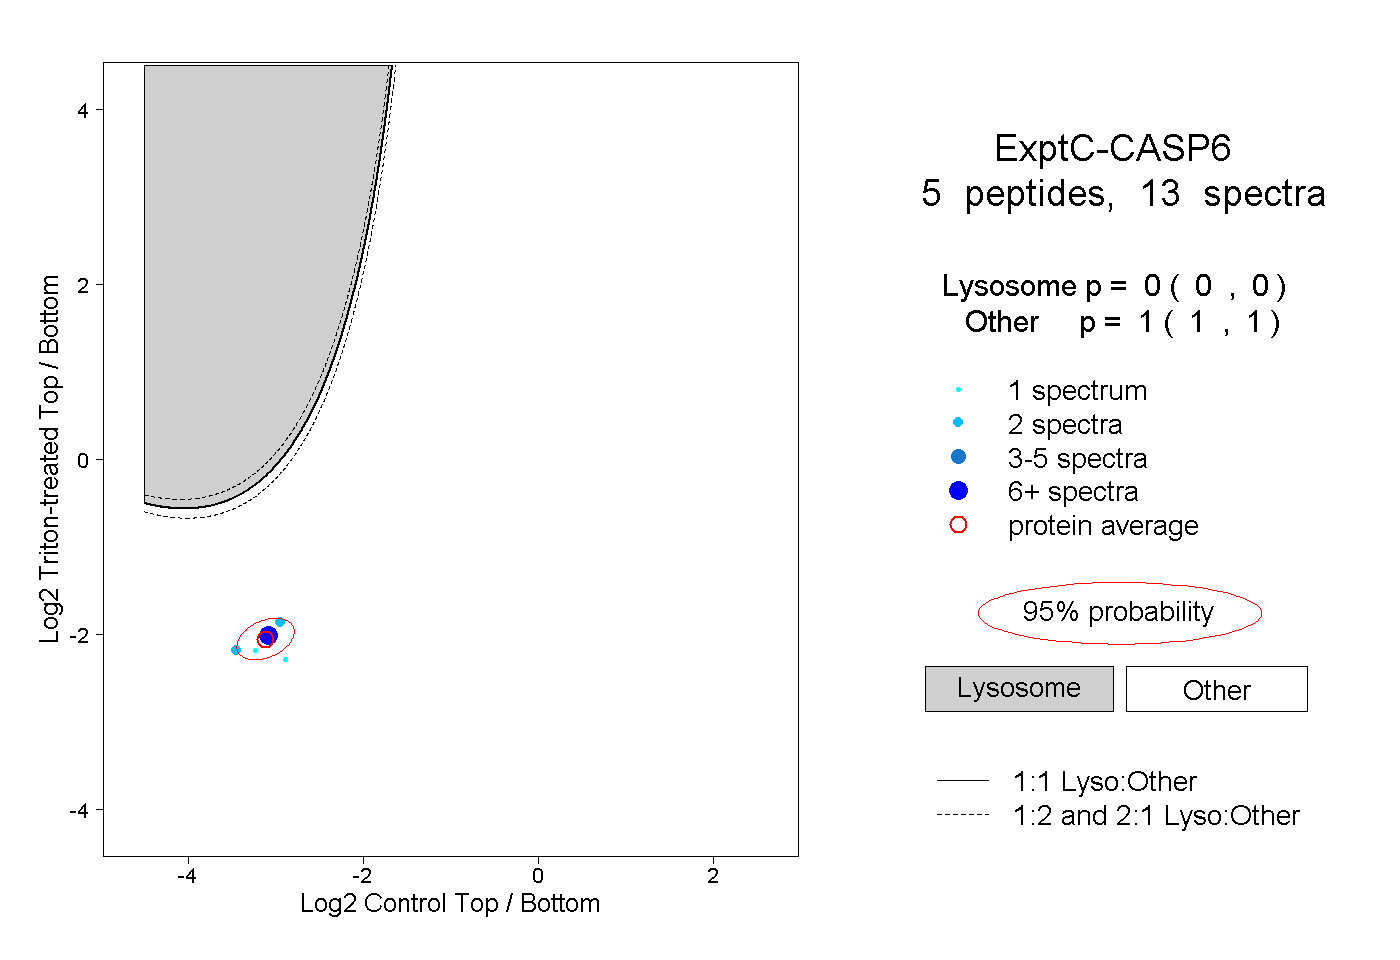 |
0.000 0.000 | 0.000 |
1.000 1.000 | 1.000 |