 9
9peptides
spectra
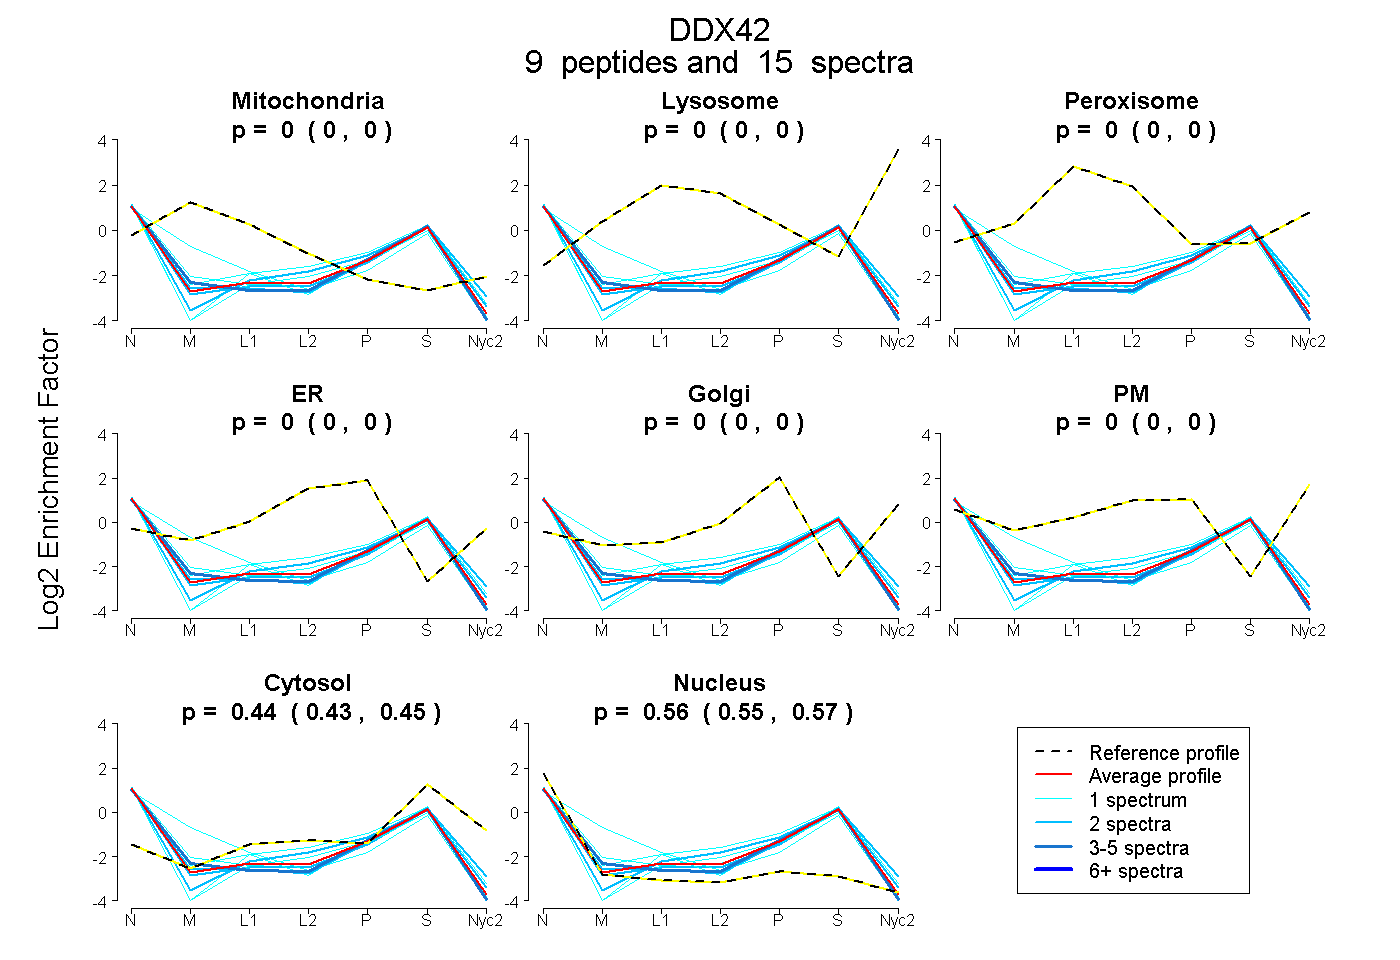
0.000 | 0.000
0.000 | 0.000
0.000 | 0.000
0.000 | 0.000
0.000 | 0.000
0.000 | 0.000
0.433 | 0.446
0.553 | 0.566
| Plot | Mito | Lyso | Perox | ER | Golgi | PM | Cytosol | Nucleus | |||||
| Expt A |
9 peptides |
15 spectra |
|
0.000 0.000 | 0.000 |
0.000 0.000 | 0.000 |
0.000 0.000 | 0.000 |
0.000 0.000 | 0.000 |
0.000 0.000 | 0.000 |
0.000 0.000 | 0.000 |
0.440 0.433 | 0.446 |
0.560 0.553 | 0.566 |
| 1 spectrum, ELEPGDGPIAVIVCPTR | 0.000 | 0.000 | 0.000 | 0.000 | 0.000 | 0.000 | 0.435 | 0.565 | ||
| 2 spectra, VSYLVFDEADR | 0.000 | 0.000 | 0.000 | 0.000 | 0.000 | 0.000 | 0.472 | 0.528 | ||
| 1 spectrum, DIDTHTHR | 0.000 | 0.000 | 0.000 | 0.002 | 0.000 | 0.000 | 0.528 | 0.469 | ||
| 1 spectrum, LIDHVK | 0.000 | 0.000 | 0.000 | 0.000 | 0.000 | 0.000 | 0.431 | 0.569 | ||
| 2 spectra, DILIDPIR | 0.000 | 0.000 | 0.000 | 0.000 | 0.000 | 0.000 | 0.441 | 0.559 | ||
| 1 spectrum, DIPVLVATDVAAR | 0.247 | 0.000 | 0.000 | 0.000 | 0.000 | 0.000 | 0.278 | 0.475 | ||
| 1 spectrum, QTLLFSATFR | 0.000 | 0.000 | 0.000 | 0.000 | 0.000 | 0.000 | 0.414 | 0.586 | ||
| 4 spectra, WNWLTR | 0.000 | 0.000 | 0.000 | 0.000 | 0.000 | 0.000 | 0.408 | 0.592 | ||
| 2 spectra, ERPGLGSENSDR | 0.000 | 0.000 | 0.000 | 0.000 | 0.000 | 0.000 | 0.443 | 0.557 |
| Plot | Mito | Lyso or Perox | ER | Golgi | PM | Cytosol | Nucleus | ||||||
| Expt B |
3 peptides |
5 spectra |
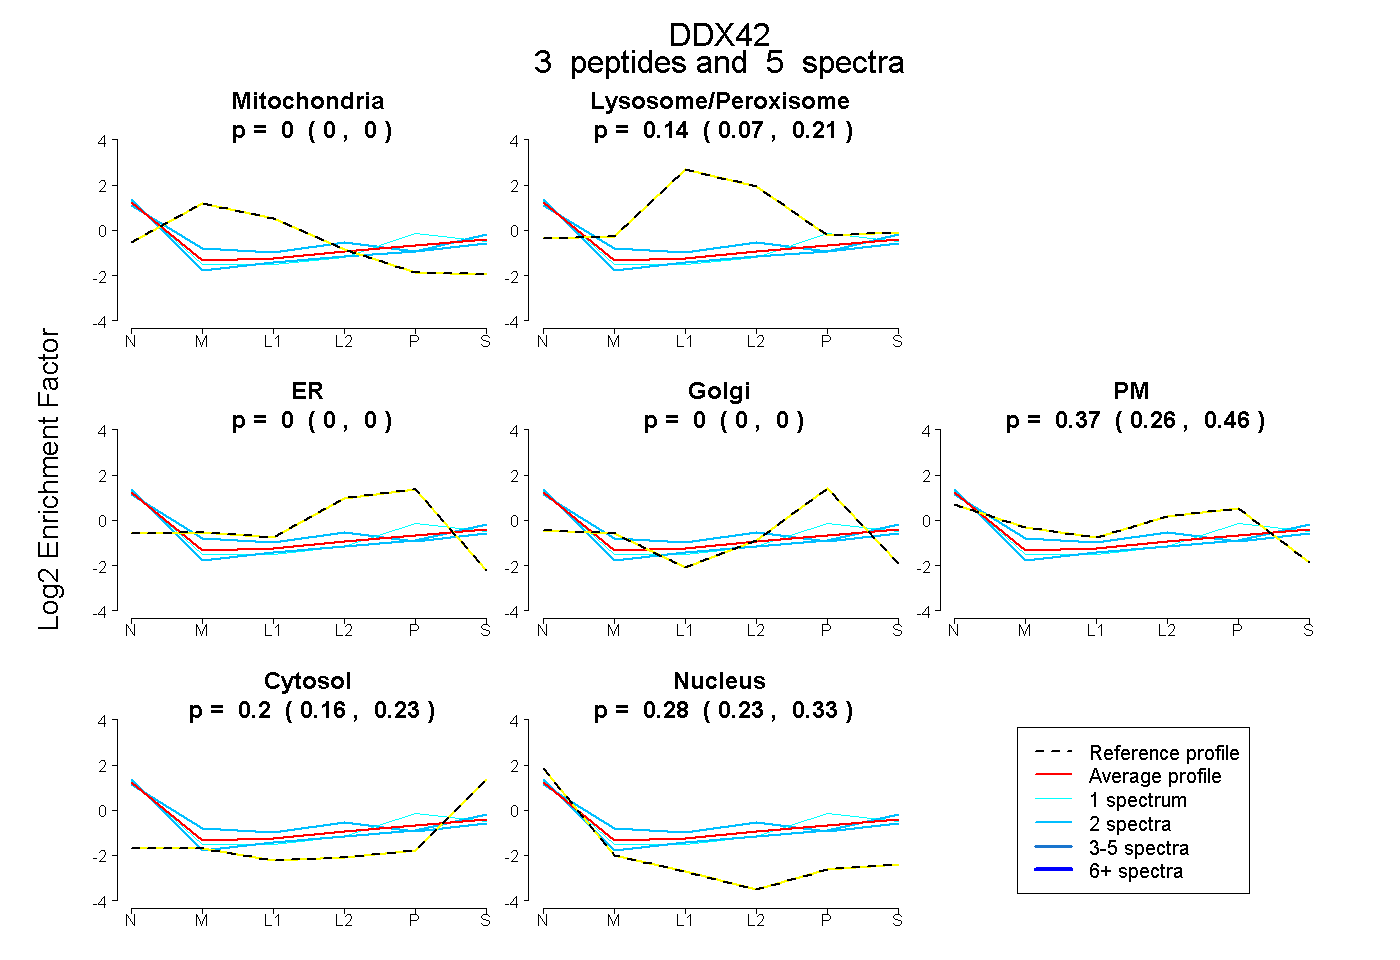 |
0.000 0.000 | 0.000 |
0.143 0.067 | 0.207 |
0.000 0.000 | 0.000 |
0.000 0.000 | 0.000 |
0.374 0.265 | 0.458 |
0.199 0.161 | 0.234 |
0.284 0.225 | 0.334 |
|||
| Plot | Lyso | Other | |||||||||||
| Expt C |
2 peptides |
3 spectra |
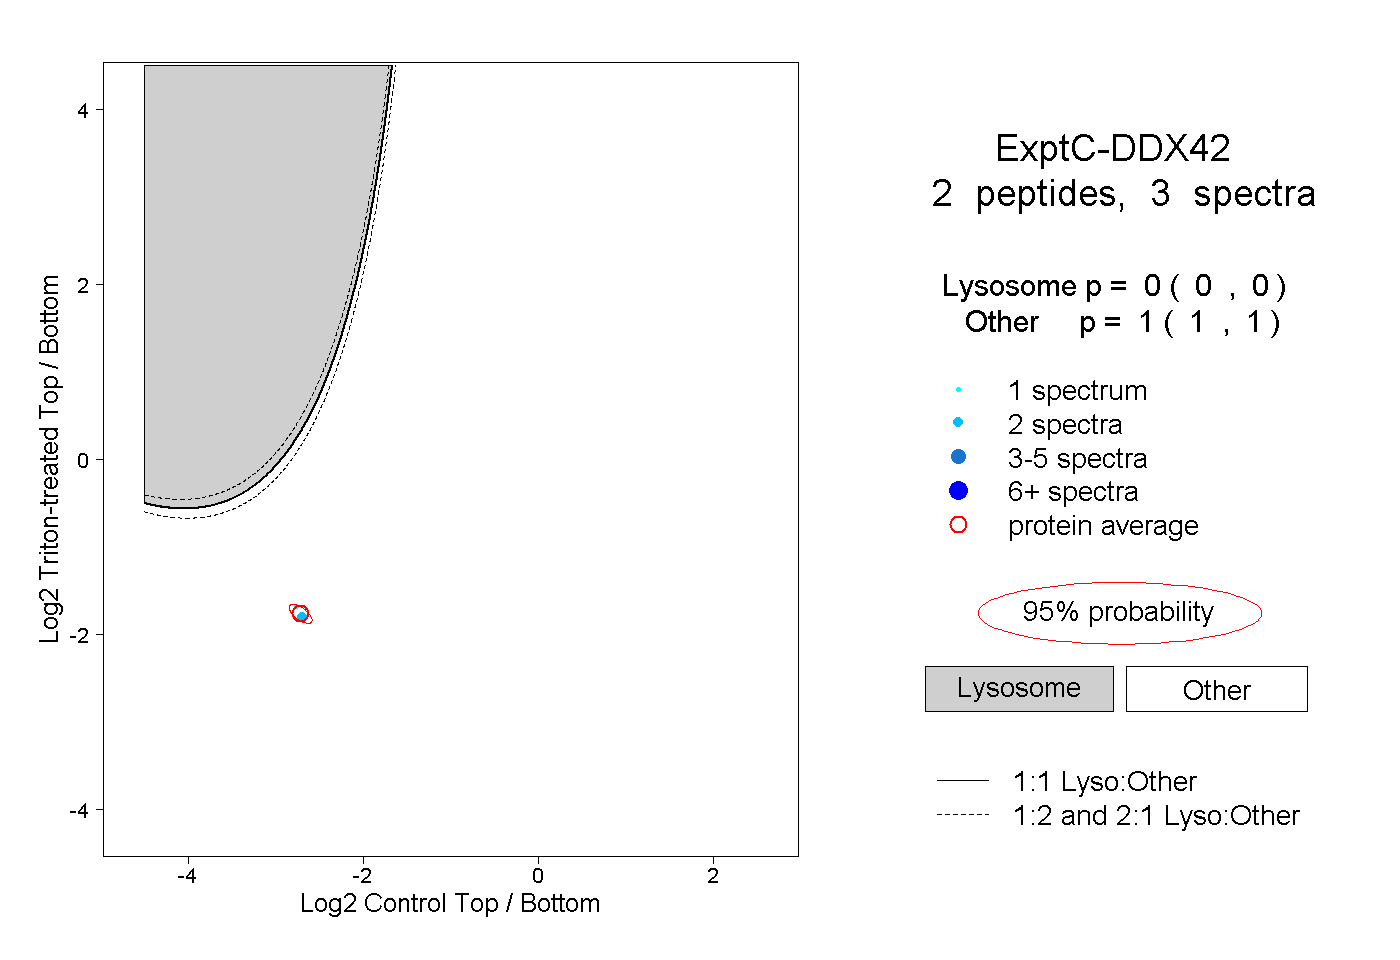 |
0.000 0.000 | 0.000 |
1.000 1.000 | 1.000 |