11
11peptides
spectra
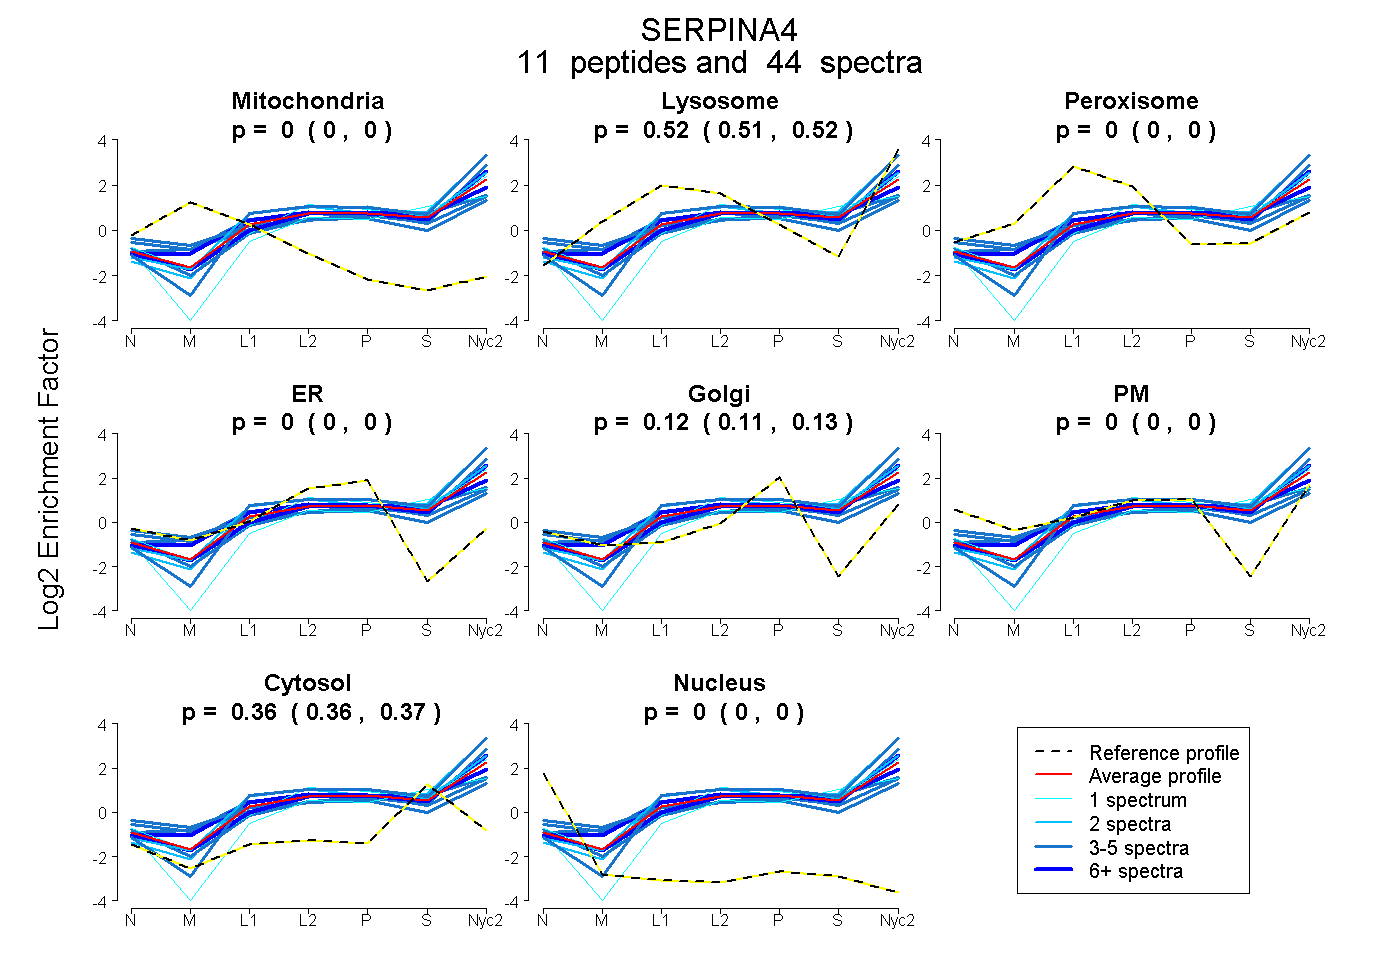
0.000 | 0.000
0.507 | 0.525
0.000 | 0.000
0.000 | 0.000
0.114 | 0.125
0.000 | 0.000
0.357 | 0.368
0.000 | 0.000
5peptides
spectra
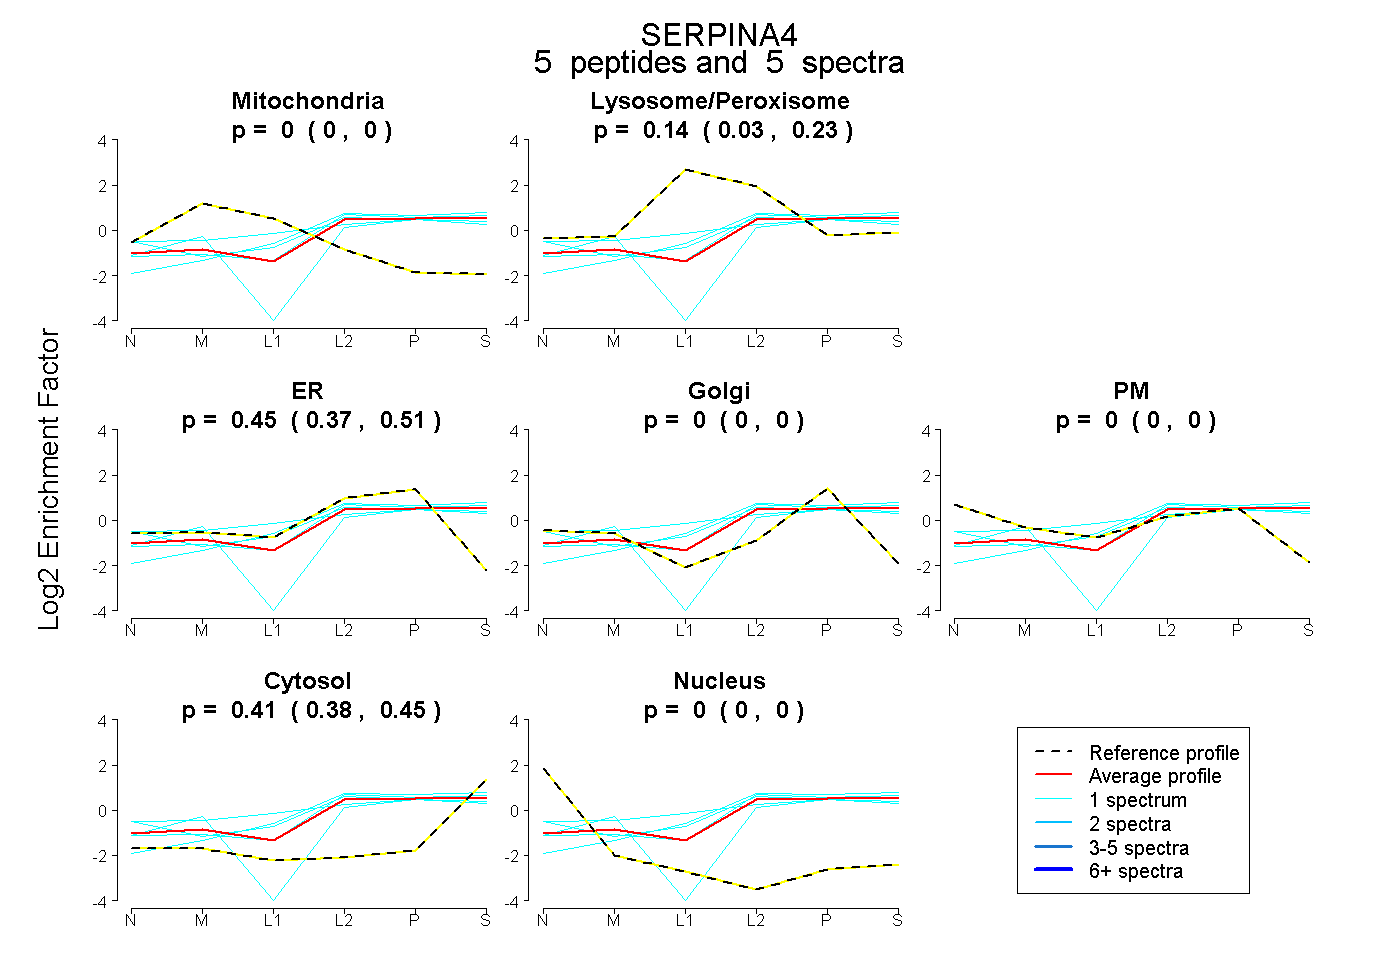
0.000 | 0.000
0.028 | 0.229
0.368 | 0.514
0.000 | 0.000
0.000 | 0.000
0.377 | 0.449
0.000 | 0.000
11peptides
spectra

0.000 | 0.000
1.000 | 1.000