 11
11peptides
spectra
0.000 | 0.000
0.507 | 0.525
0.000 | 0.000
0.000 | 0.000
0.114 | 0.125
0.000 | 0.000
0.357 | 0.368
0.000 | 0.000
| Plot | Mito | Lyso | Perox | ER | Golgi | PM | Cytosol | Nucleus | |||||
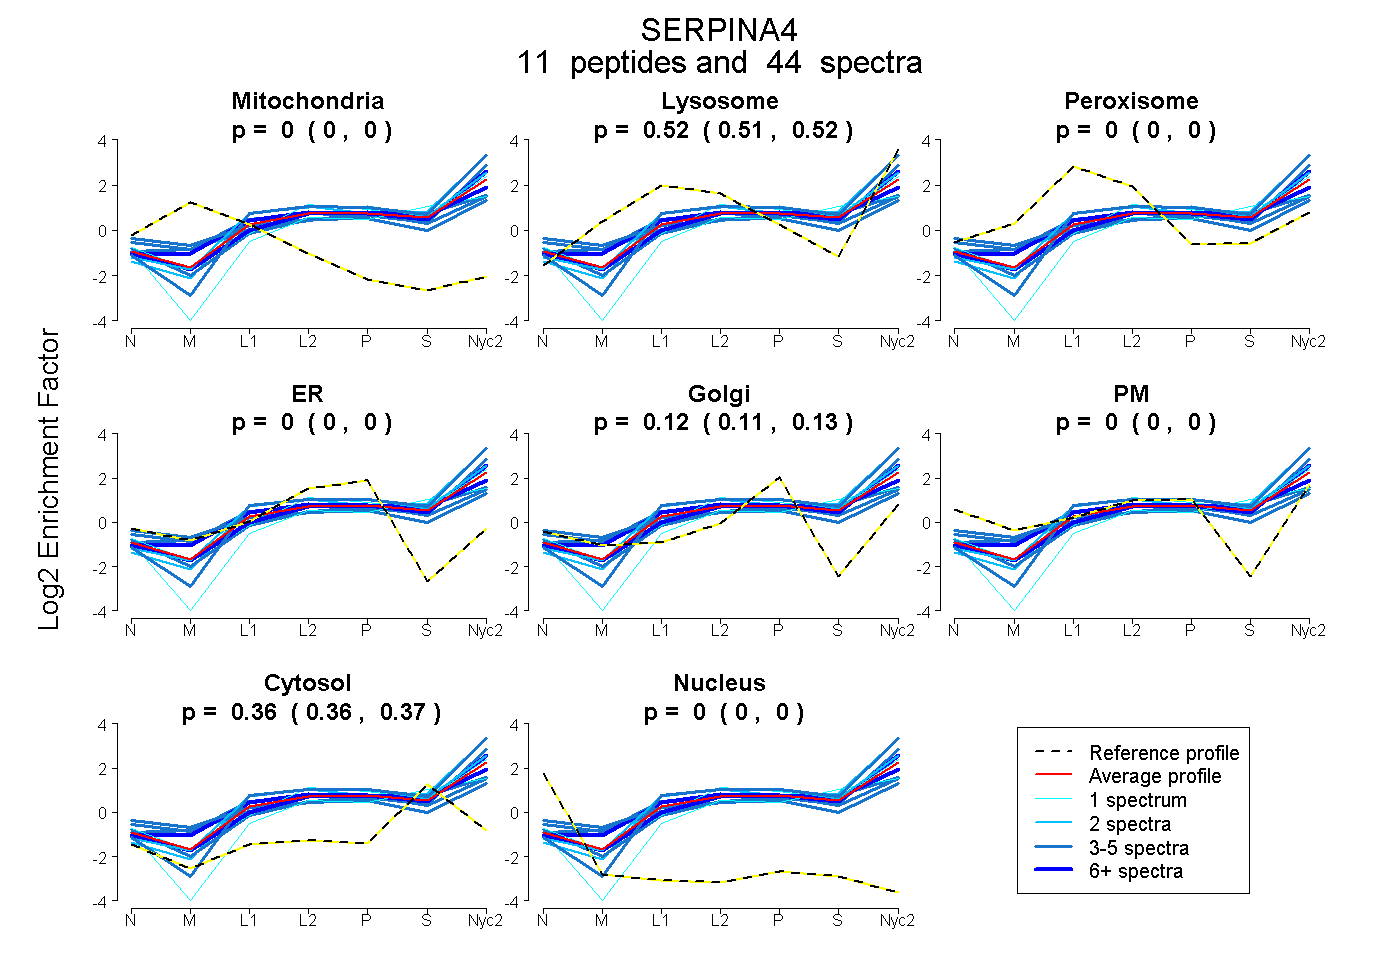
| Expt A |
11 peptides |
44 spectra |
|
0.000 0.000 | 0.000 |
0.517 0.507 | 0.525 |
0.000 0.000 | 0.000 |
0.000 0.000 | 0.000 |
0.120 0.114 | 0.125 |
0.000 0.000 | 0.000 |
0.363 0.357 | 0.368 |
0.000 0.000 | 0.000 |
| 5 spectra, LSLPEIHEGFR | 0.000 | 0.377 | 0.000 | 0.000 | 0.158 | 0.000 | 0.465 | 0.000 | ||
| 3 spectra, LYHLIASQNSEK | 0.000 | 0.430 | 0.000 | 0.000 | 0.218 | 0.000 | 0.352 | 0.000 | ||
| 6 spectra, MNEVEQVLSPGMLLR | 0.000 | 0.613 | 0.000 | 0.000 | 0.084 | 0.000 | 0.303 | 0.000 | ||
| 3 spectra, VSTSDFYVDENTVVK | 0.000 | 0.634 | 0.000 | 0.000 | 0.029 | 0.000 | 0.337 | 0.000 | ||
| 1 spectrum, QNTQGK | 0.000 | 0.495 | 0.000 | 0.000 | 0.168 | 0.005 | 0.332 | 0.000 | ||
| 3 spectra, NLVSDLSPDVK | 0.000 | 0.256 | 0.079 | 0.000 | 0.051 | 0.286 | 0.327 | 0.000 | ||
| 1 spectrum, TVLDVNEVGTK | 0.000 | 0.246 | 0.000 | 0.000 | 0.132 | 0.000 | 0.622 | 0.000 | ||
| 14 spectra, VLHANFR | 0.000 | 0.455 | 0.000 | 0.000 | 0.140 | 0.000 | 0.406 | 0.000 | ||
| 2 spectra, VPCTVLR | 0.000 | 0.614 | 0.000 | 0.000 | 0.073 | 0.000 | 0.313 | 0.000 | ||
| 4 spectra, EDHWYLEDR | 0.000 | 0.583 | 0.000 | 0.000 | 0.000 | 0.143 | 0.273 | 0.000 | ||
| 2 spectra, GDAVAFFILPDQGK | 0.000 | 0.676 | 0.000 | 0.000 | 0.000 | 0.000 | 0.324 | 0.000 |
| Plot | Mito | Lyso or Perox | ER | Golgi | PM | Cytosol | Nucleus | ||||||
| Expt B |
5 peptides |
5 spectra |
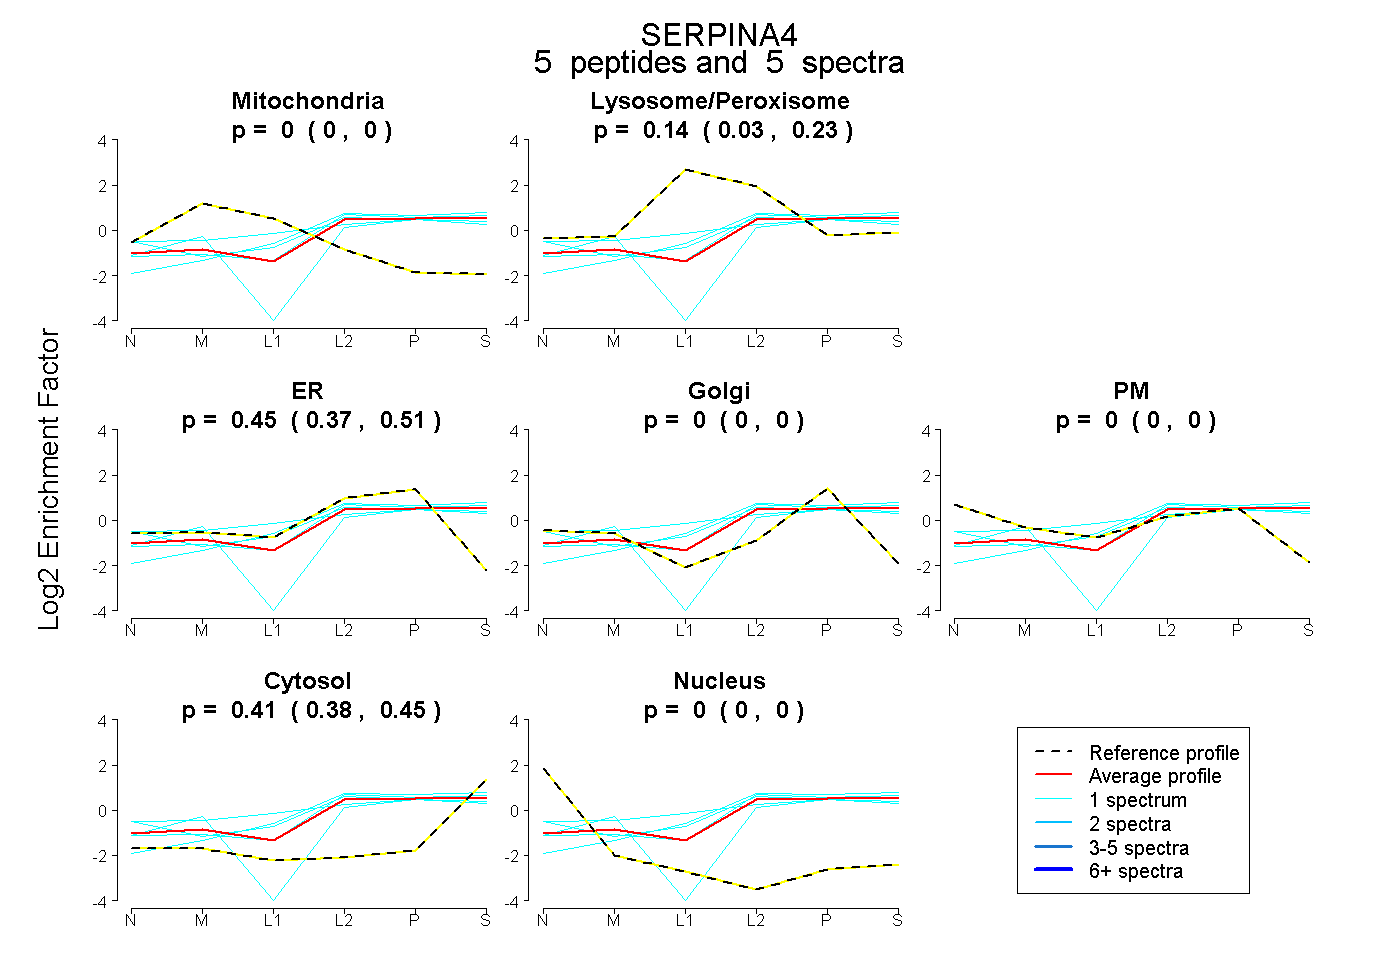 |
0.000 0.000 | 0.000 |
0.138 0.028 | 0.229 |
0.448 0.368 | 0.514 |
0.000 0.000 | 0.000 |
0.000 0.000 | 0.000 |
0.414 0.377 | 0.449 |
0.000 0.000 | 0.000 |
|||
| Plot | Lyso | Other | |||||||||||
| Expt C |
11 peptides |
61 spectra |
 |
0.000 0.000 | 0.000 |
1.000 1.000 | 1.000 |
||||||||
| Plot | Lyso | Other | |||||||||||
| Expt D |
2 peptides |
3 spectra |
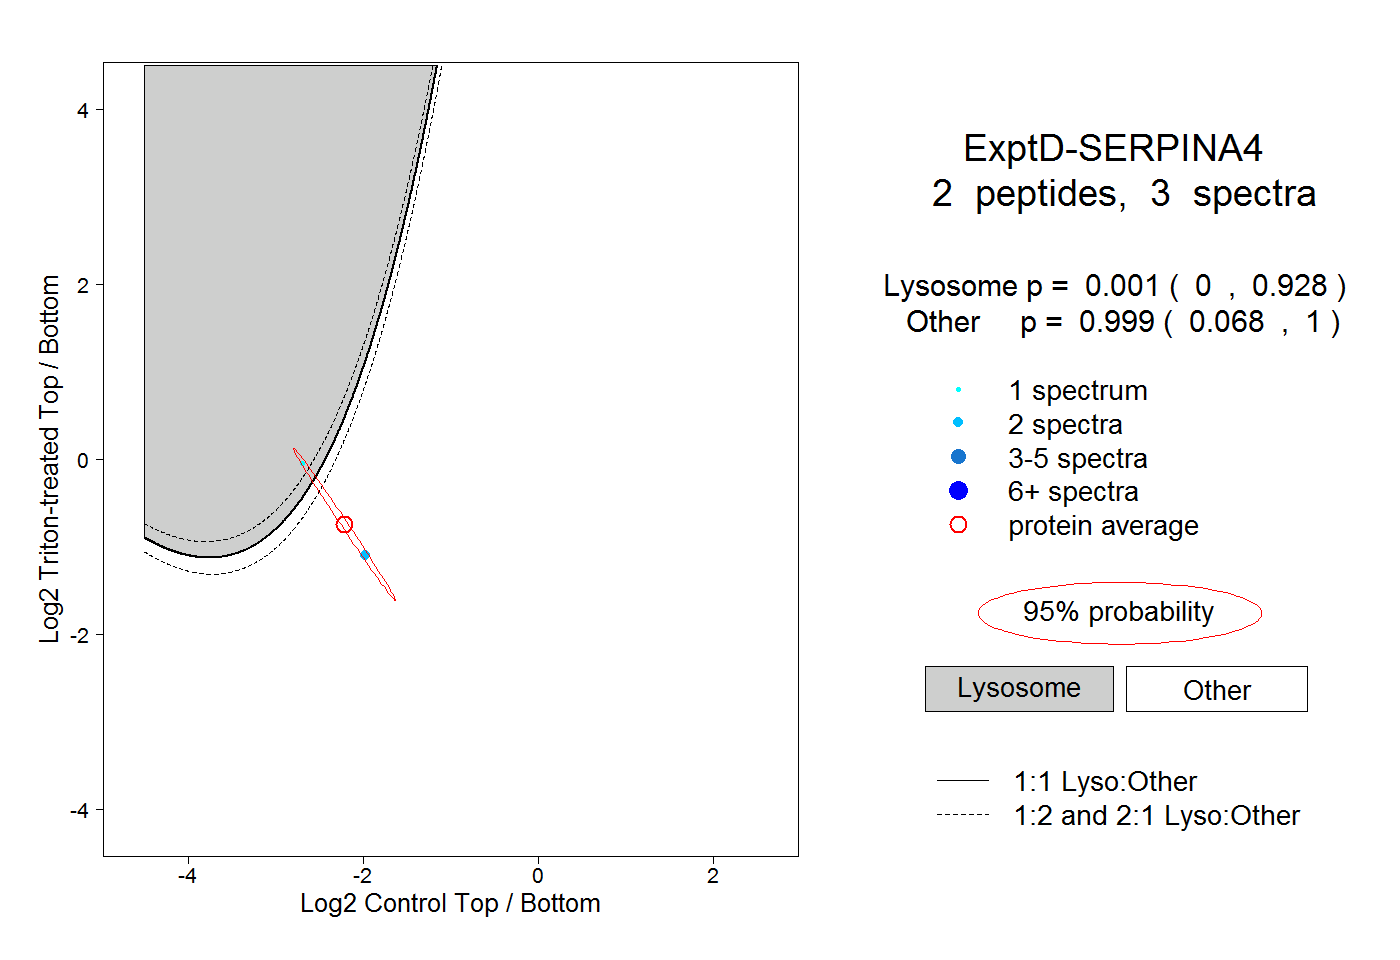 |
0.001 0.000 | 0.928 |
0.999 0.068 | 1.000 |