 8
8peptides
spectra
0.000 | 0.026
0.000 | 0.000
0.000 | 0.036
0.855 | 0.899
0.000 | 0.000
0.020 | 0.079
0.000 | 0.022
0.018 | 0.042
| Plot | Mito | Lyso | Perox | ER | Golgi | PM | Cytosol | Nucleus | |||||
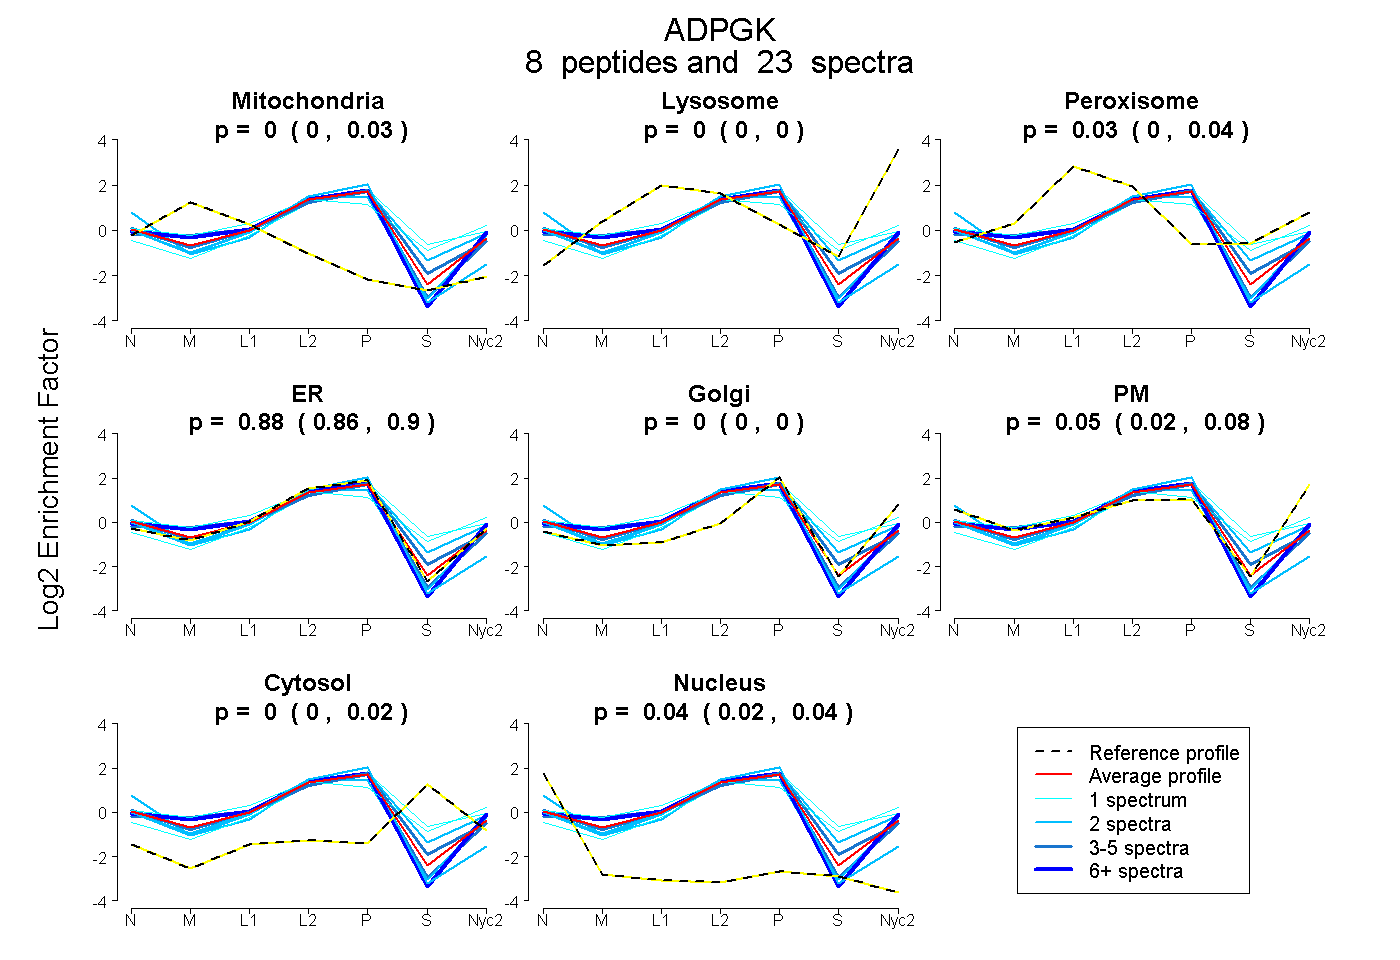
| Expt A |
8 peptides |
23 spectra |
|
0.003 0.000 | 0.026 |
0.000 0.000 | 0.000 |
0.029 0.000 | 0.036 |
0.881 0.855 | 0.899 |
0.000 0.000 | 0.000 |
0.049 0.020 | 0.079 |
0.002 0.000 | 0.022 |
0.037 0.018 | 0.042 |
| 9 spectra, SLWSSLR | 0.047 | 0.000 | 0.000 | 0.823 | 0.000 | 0.130 | 0.000 | 0.000 | ||
| 3 spectra, APQEFMTSR | 0.105 | 0.000 | 0.000 | 0.895 | 0.000 | 0.000 | 0.000 | 0.000 | ||
| 1 spectrum, VAGTQACATETIDTNR | 0.000 | 0.000 | 0.248 | 0.433 | 0.000 | 0.188 | 0.130 | 0.000 | ||
| 2 spectra, IVLNPNKPVVEWHR | 0.000 | 0.000 | 0.039 | 0.769 | 0.000 | 0.052 | 0.140 | 0.000 | ||
| 3 spectra, SSDLTR | 0.000 | 0.000 | 0.035 | 0.863 | 0.000 | 0.005 | 0.083 | 0.014 | ||
| 2 spectra, DHAVLHSR | 0.000 | 0.000 | 0.000 | 0.708 | 0.000 | 0.204 | 0.000 | 0.088 | ||
| 2 spectra, VLLCGPIGPK | 0.000 | 0.000 | 0.000 | 0.926 | 0.000 | 0.000 | 0.000 | 0.074 | ||
| 1 spectrum, SDLEEAFVHFMGK | 0.000 | 0.071 | 0.000 | 0.684 | 0.000 | 0.000 | 0.245 | 0.000 |
| Plot | Mito | Lyso or Perox | ER | Golgi | PM | Cytosol | Nucleus | ||||||
| Expt B |
4 peptides |
7 spectra |
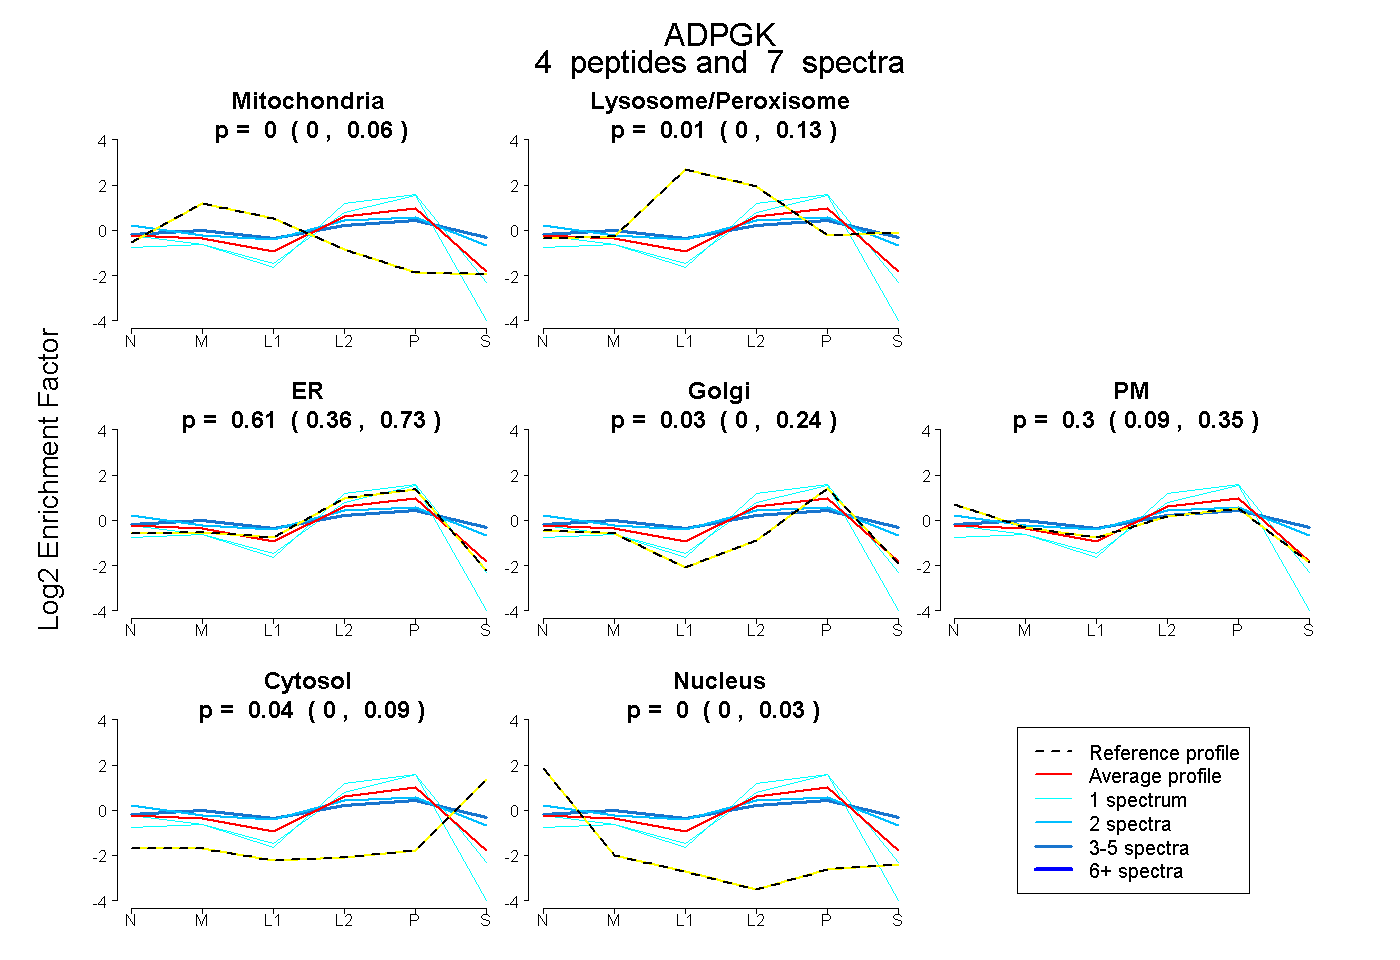 |
0.000 0.000 | 0.058 |
0.013 0.000 | 0.132 |
0.608 0.363 | 0.731 |
0.034 0.000 | 0.239 |
0.301 0.093 | 0.351 |
0.044 0.000 | 0.091 |
0.000 0.000 | 0.029 |
|||
| Plot | Lyso | Other | |||||||||||
| Expt C |
9 peptides |
30 spectra |
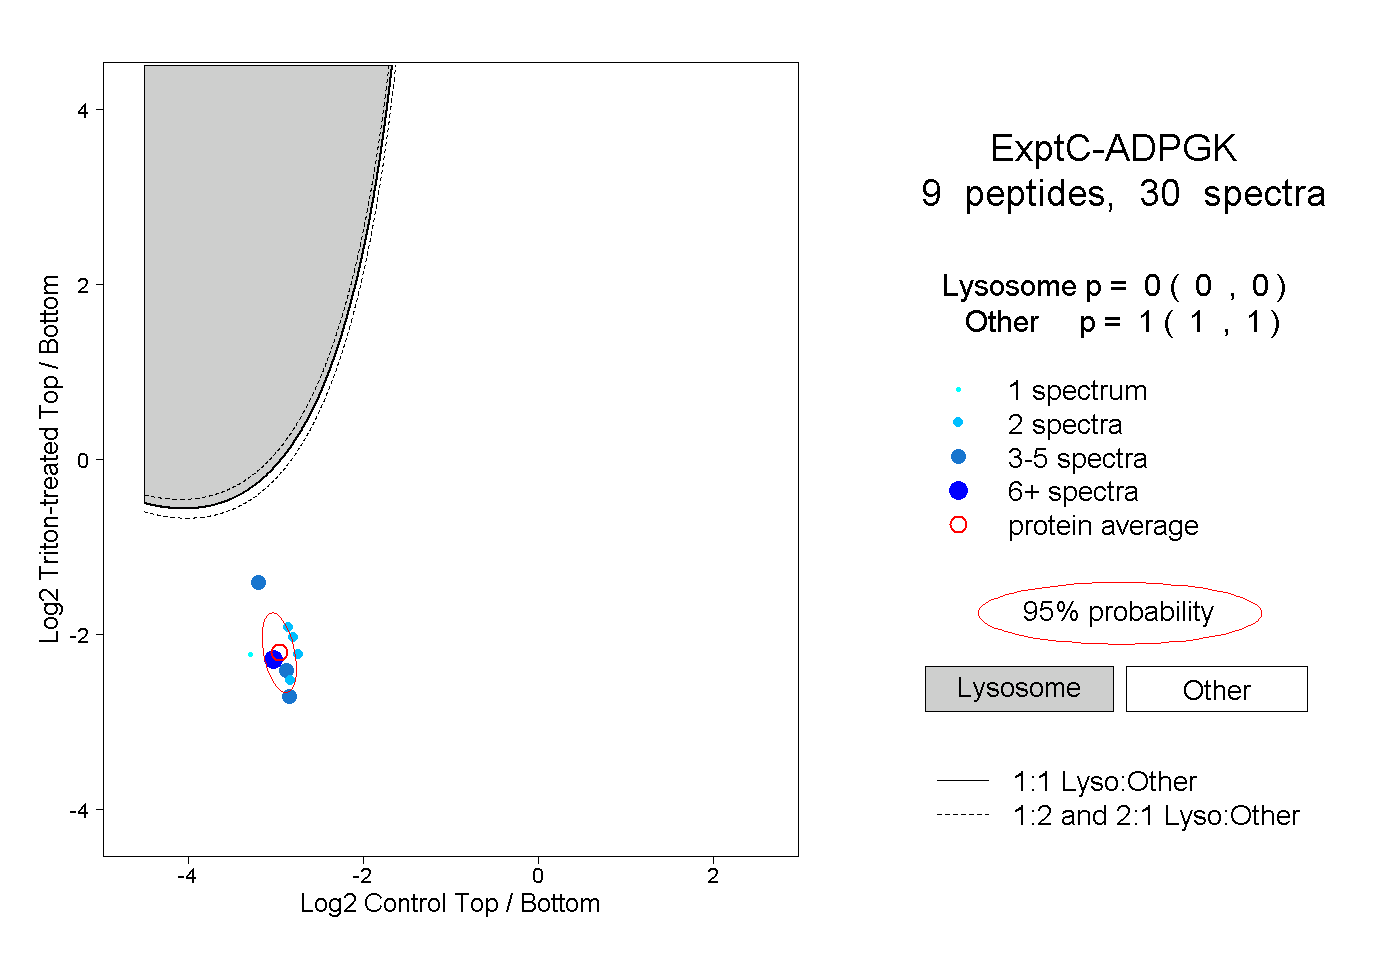 |
0.000 0.000 | 0.000 |
1.000 1.000 | 1.000 |
||||||||
| Plot | Lyso | Other | |||||||||||
| Expt D |
2 peptides |
4 spectra |
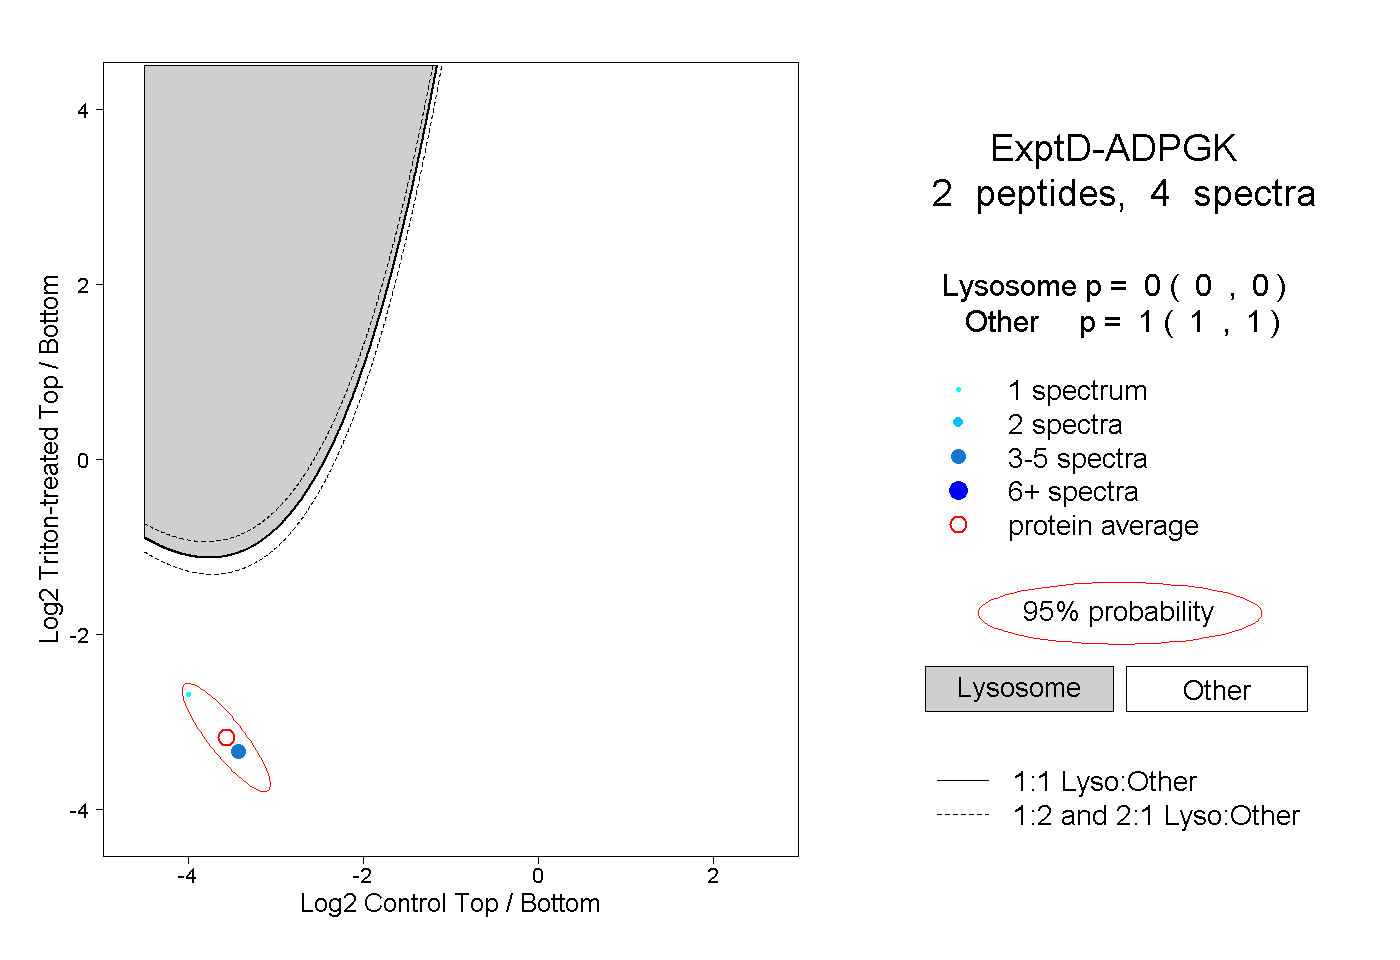 |
0.000 0.000 | 0.000 |
1.000 1.000 | 1.000 |