 8
8peptides
spectra
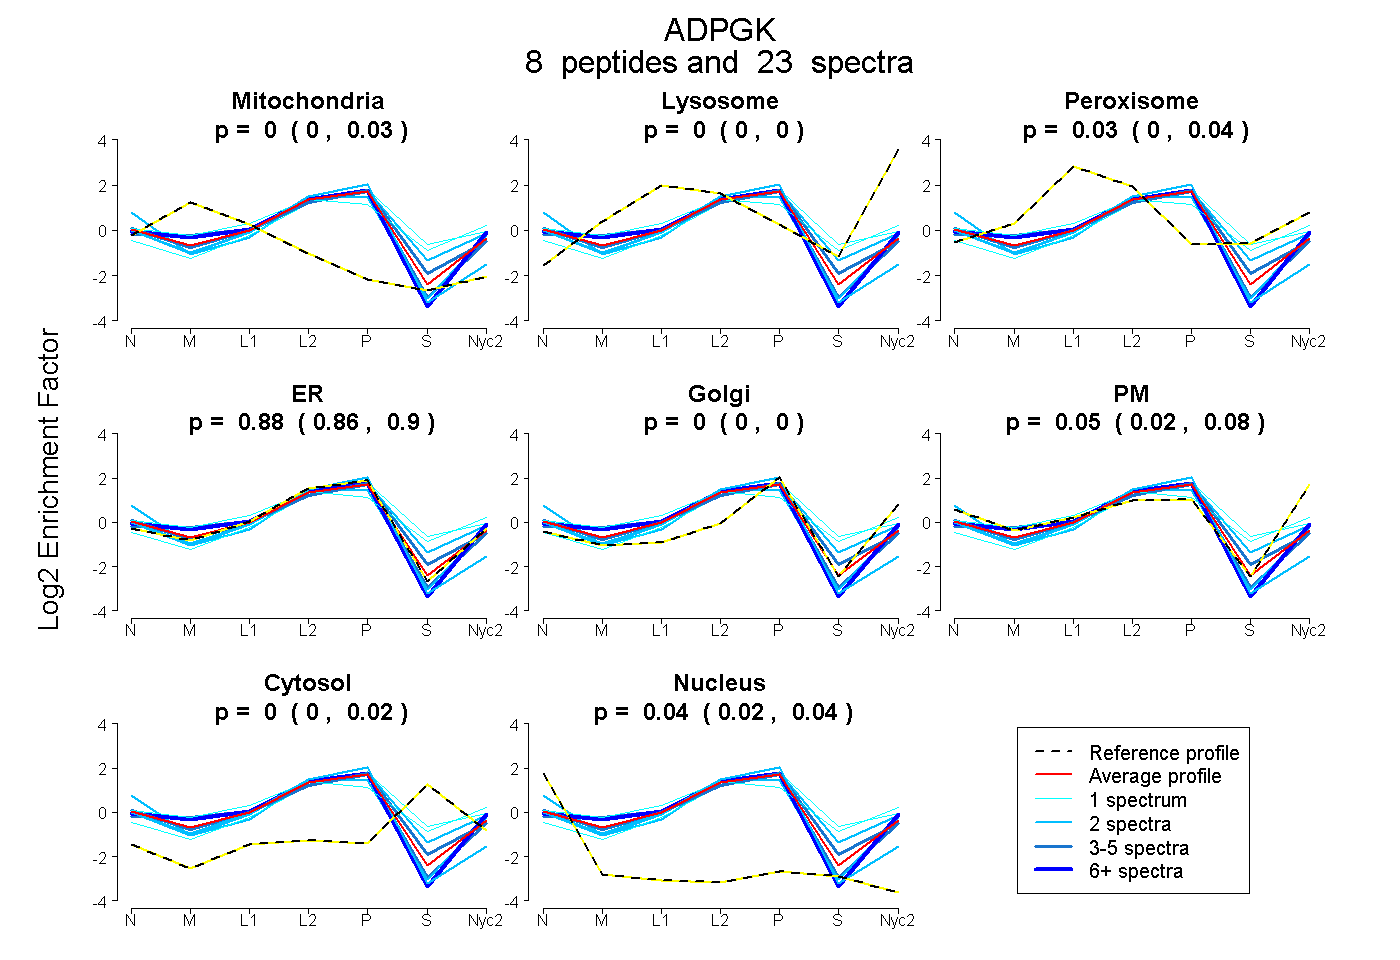
0.000 | 0.026
0.000 | 0.000
0.000 | 0.036
0.855 | 0.899
0.000 | 0.000
0.020 | 0.079
0.000 | 0.022
0.018 | 0.042
4peptides
spectra
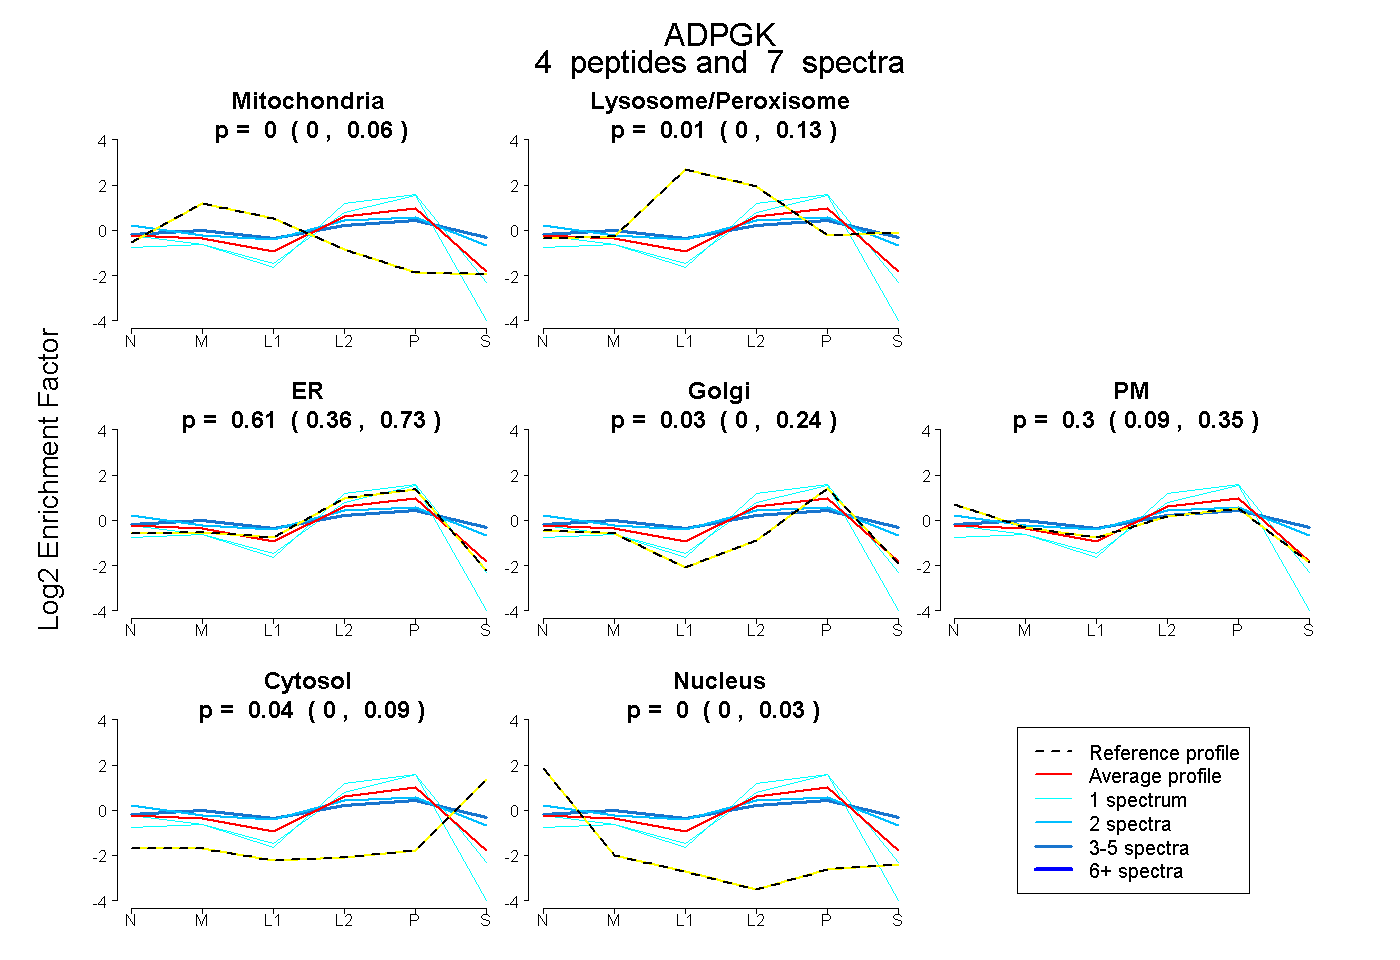
0.000 | 0.058
0.000 | 0.132
0.363 | 0.731
0.000 | 0.239
0.093 | 0.351
0.000 | 0.091
0.000 | 0.029
9peptides
spectra
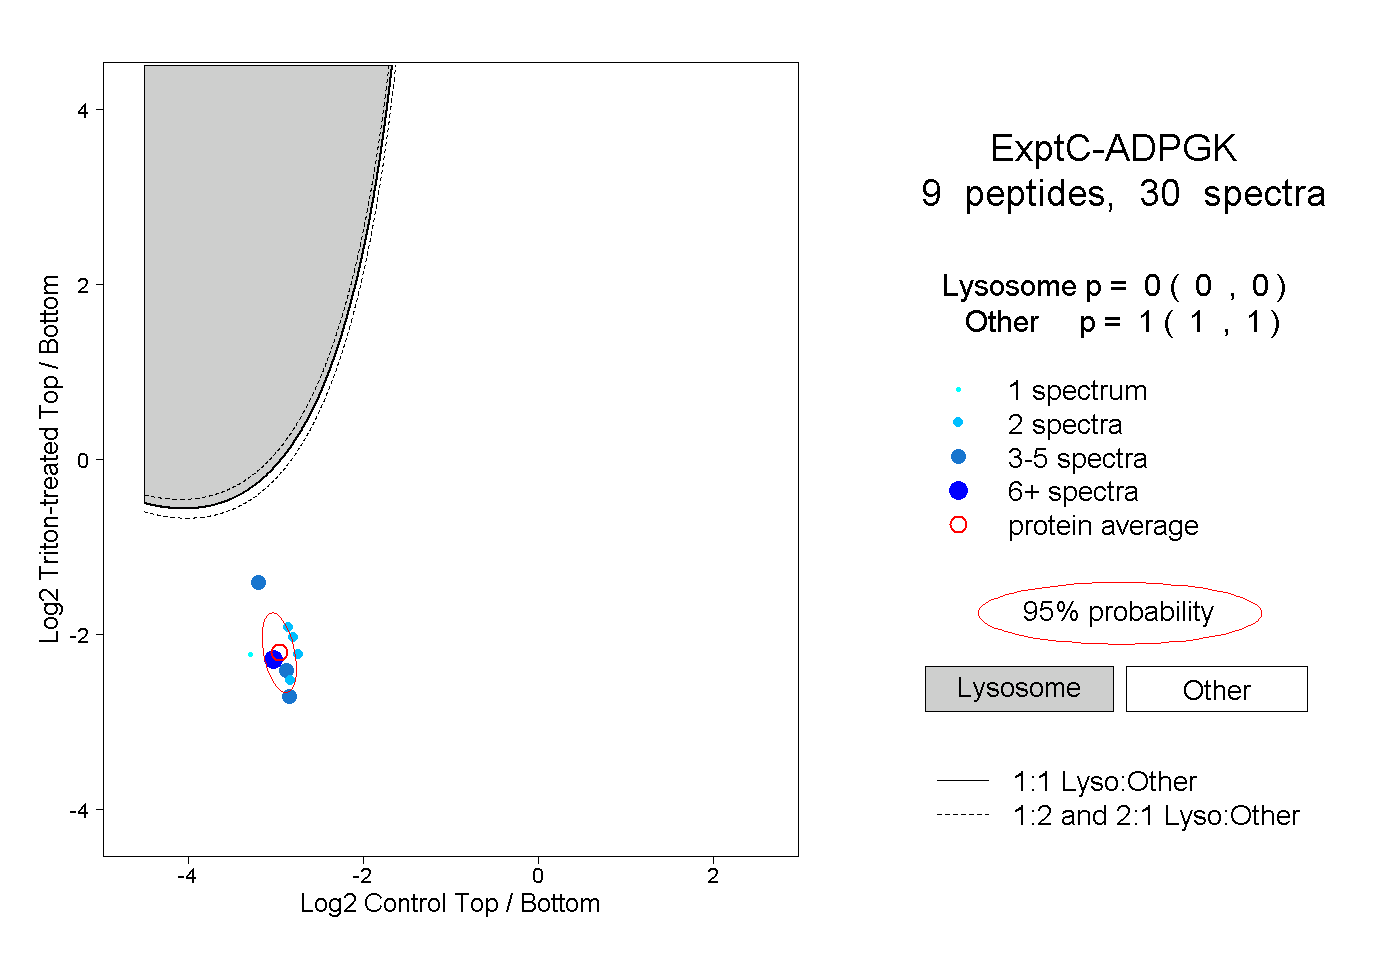
0.000 | 0.000
1.000 | 1.000
2peptides
spectra
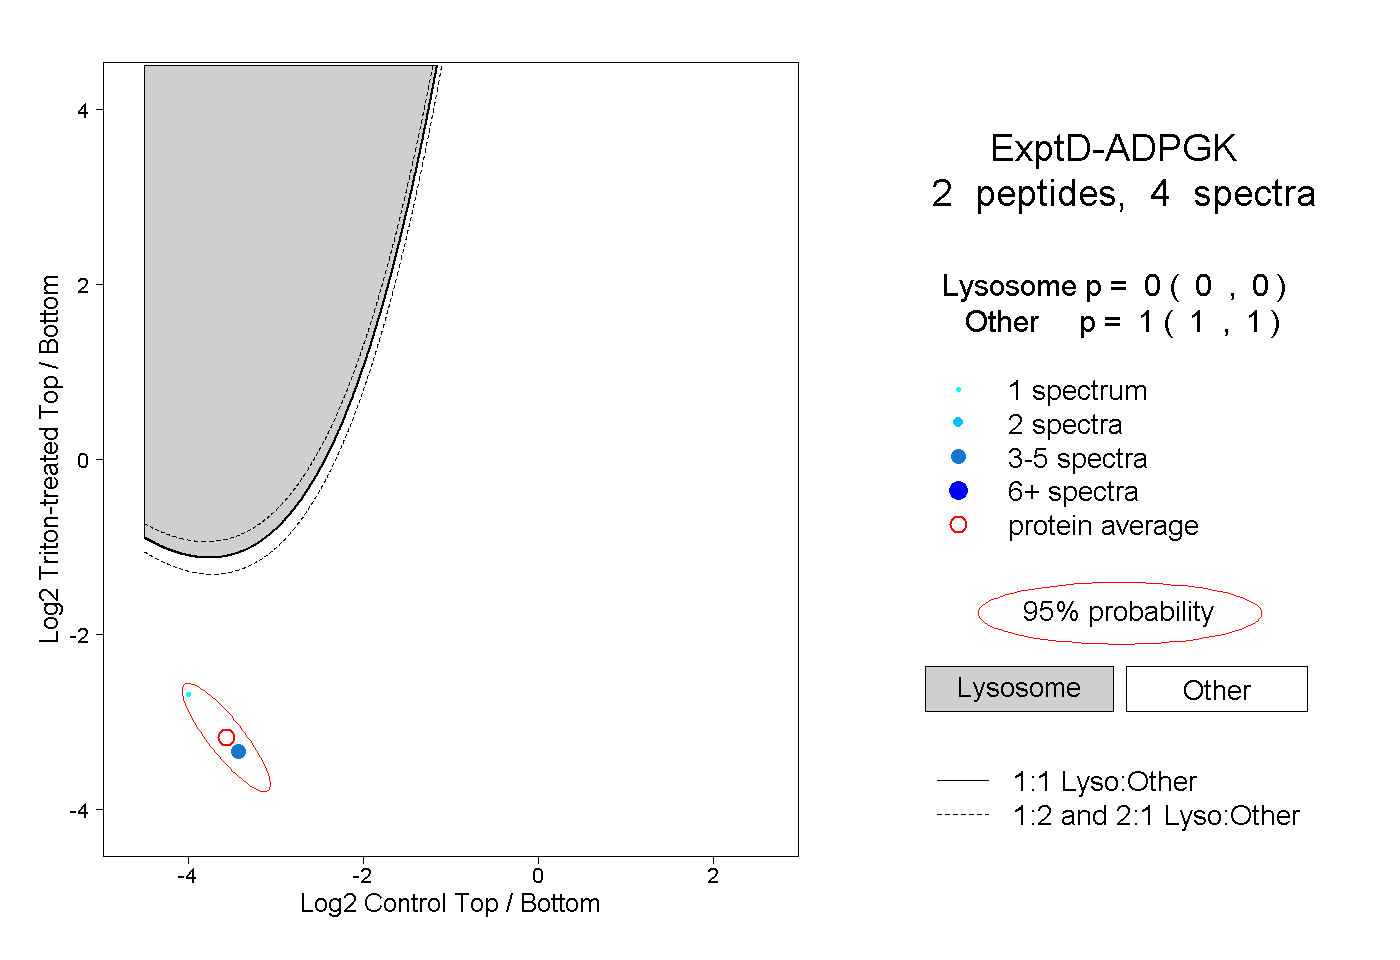
0.000 | 0.000
1.000 | 1.000