 17
17peptides
spectra
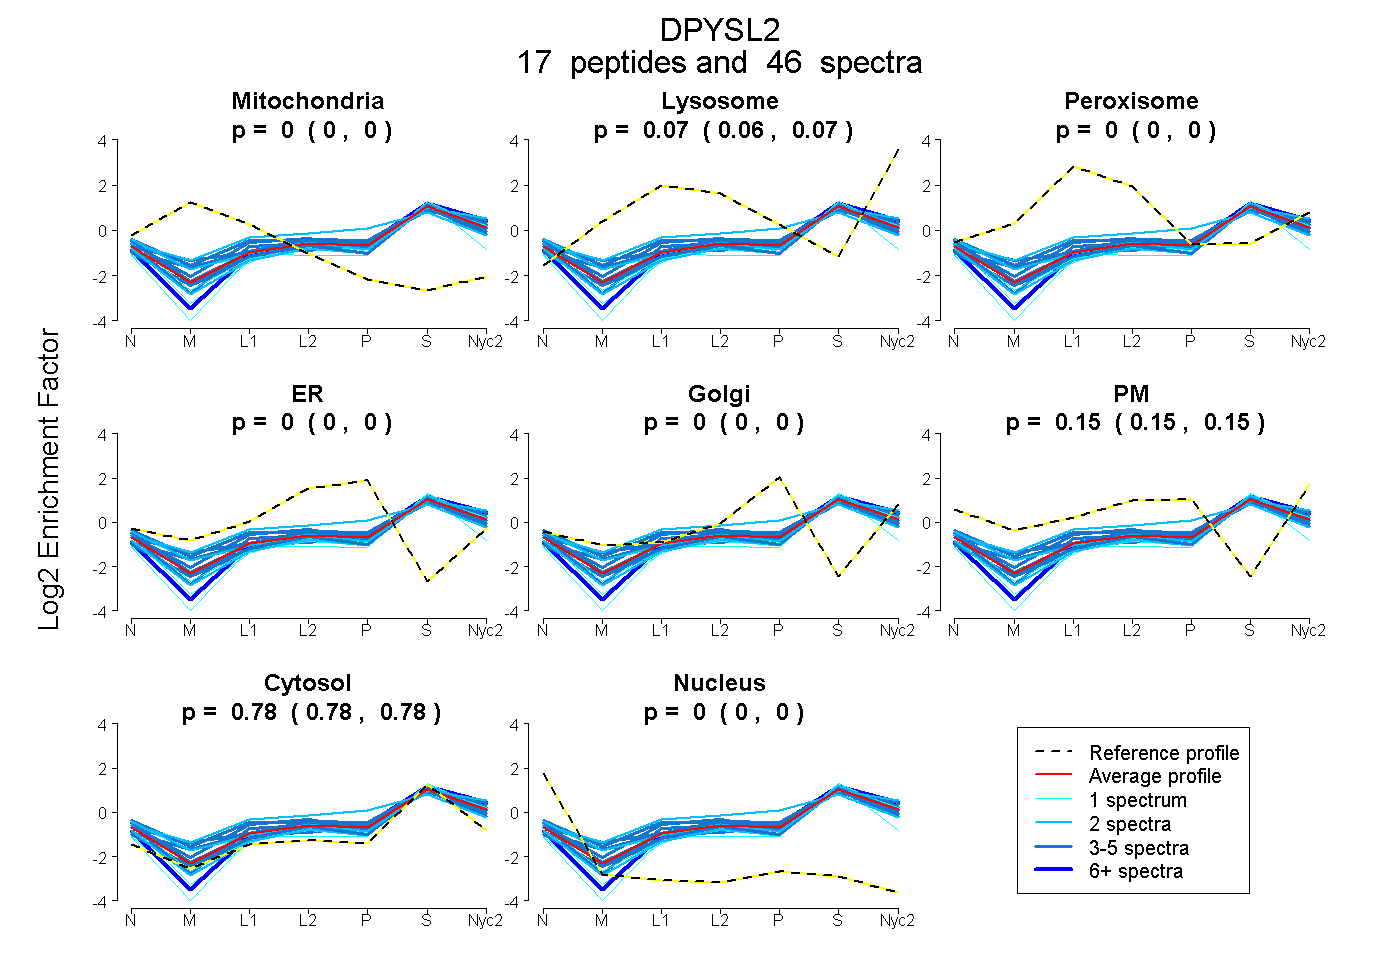
0.000 | 0.000
0.064 | 0.074
0.000 | 0.000
0.000 | 0.000
0.000 | 0.000
0.145 | 0.154
0.778 | 0.784
0.000 | 0.000
7peptides
spectra
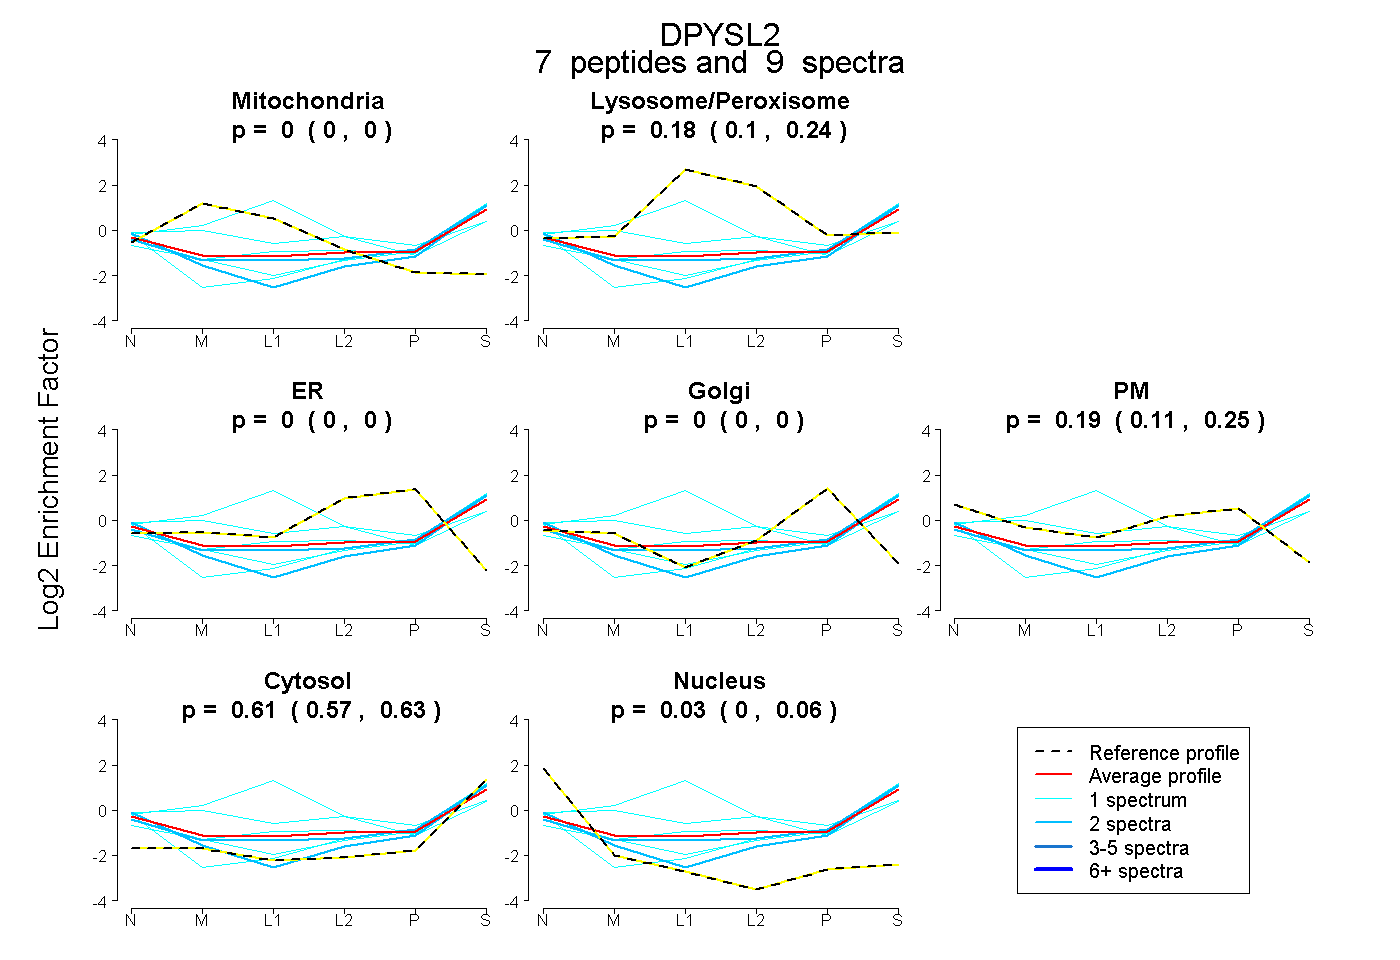
0.000 | 0.000
0.105 | 0.238
0.000 | 0.000
0.000 | 0.000
0.114 | 0.250
0.568 | 0.635
0.000 | 0.059
16peptides
spectra
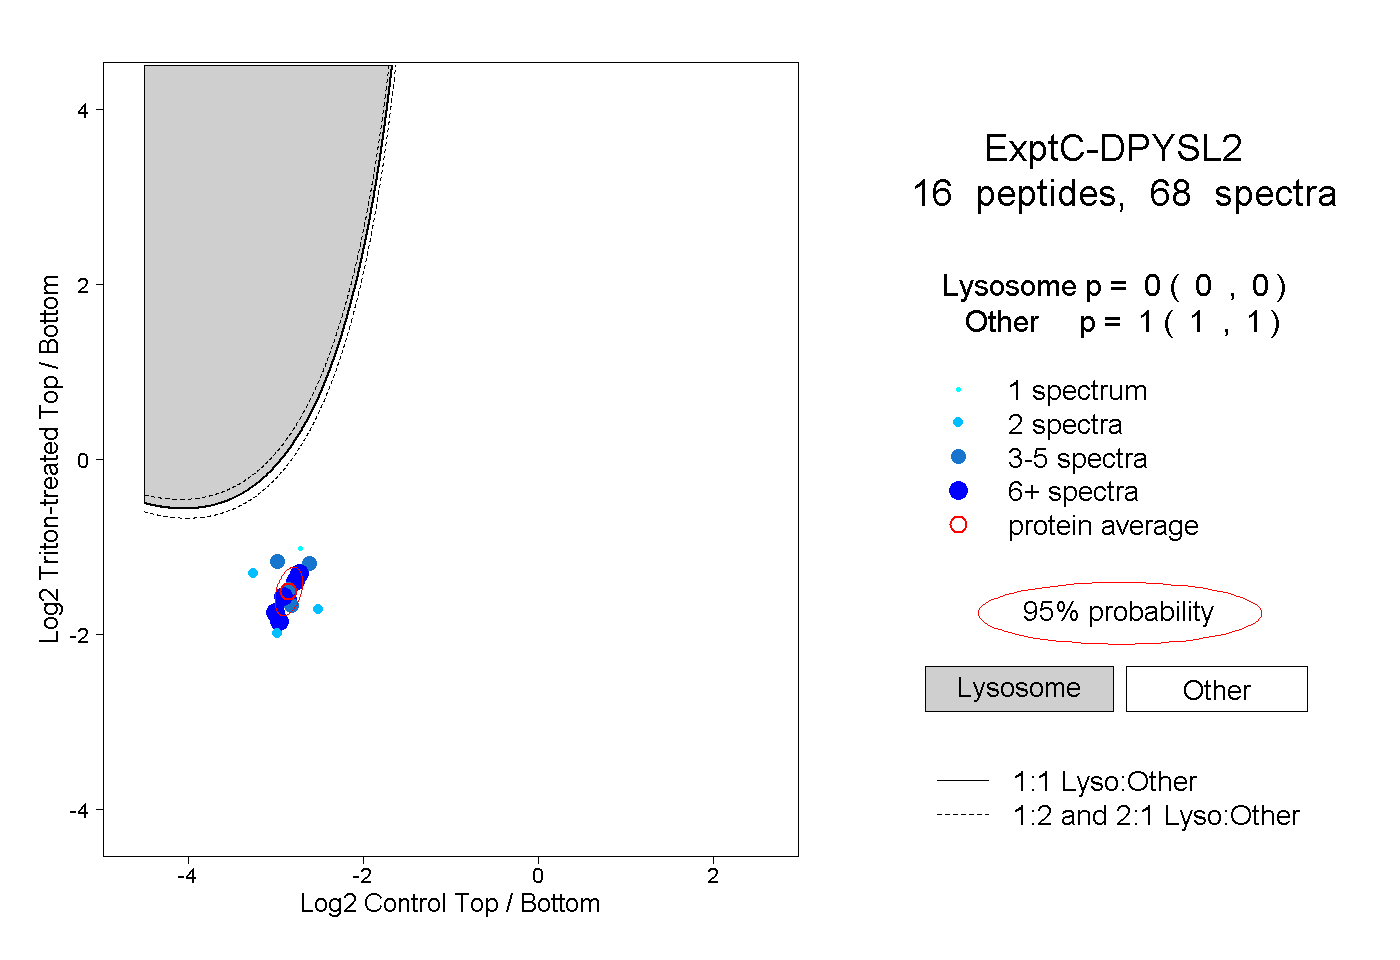
0.000 | 0.000
1.000 | 1.000
3peptides
spectra
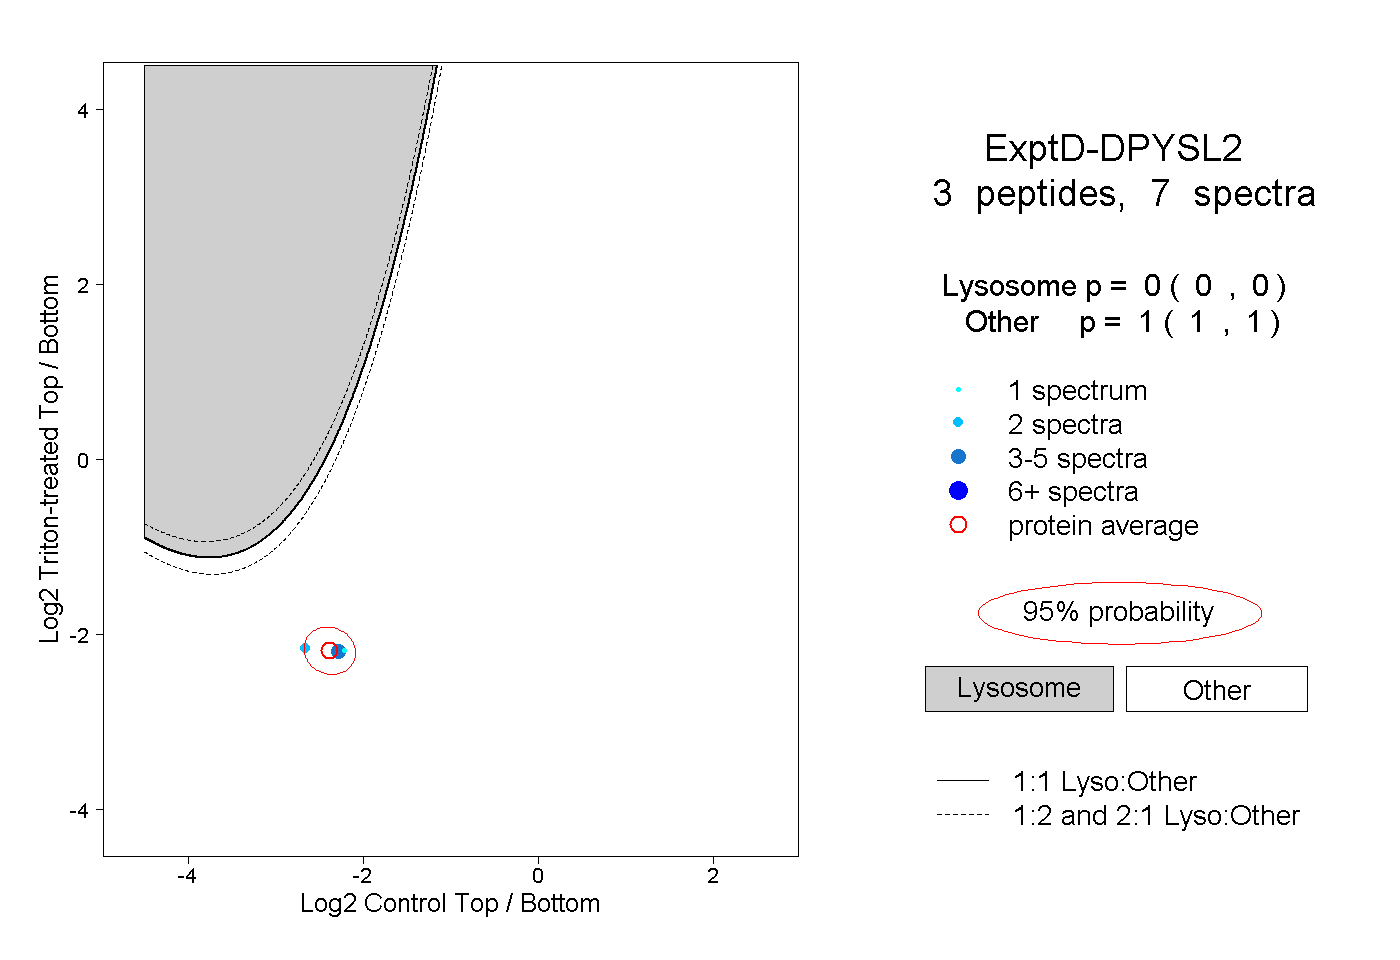
0.000 | 0.000
1.000 | 1.000