15
15peptides
spectra
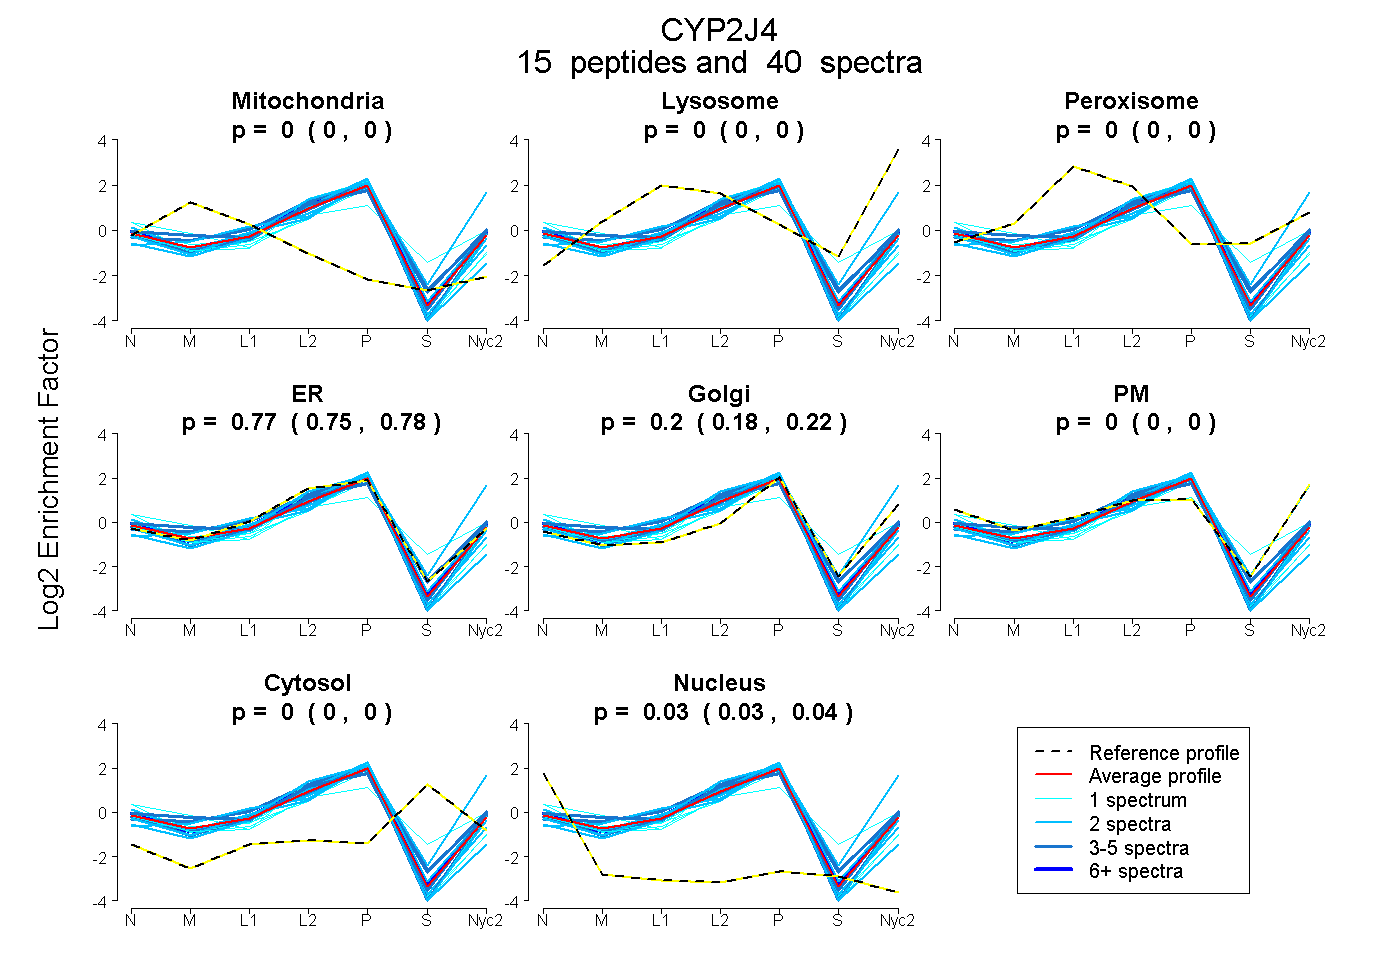
0.000 | 0.000
0.000 | 0.000
0.000 | 0.000
0.752 | 0.783
0.179 | 0.217
0.000 | 0.000
0.000 | 0.000
0.027 | 0.035
6peptides
spectra
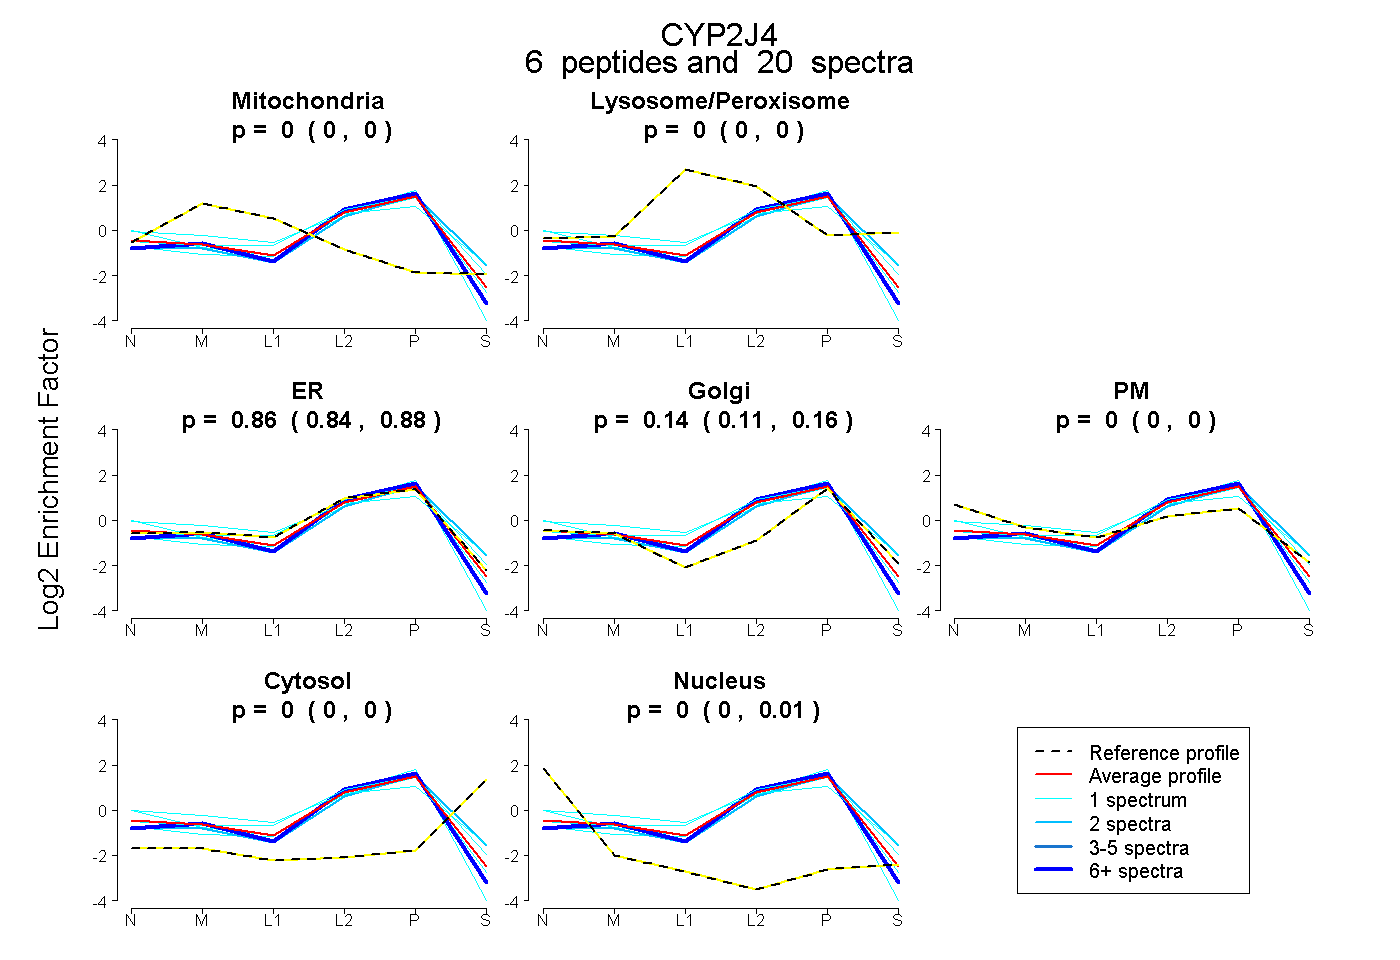
0.000 | 0.000
0.000 | 0.000
0.840 | 0.880
0.111 | 0.157
0.000 | 0.000
0.000 | 0.000
0.000 | 0.007
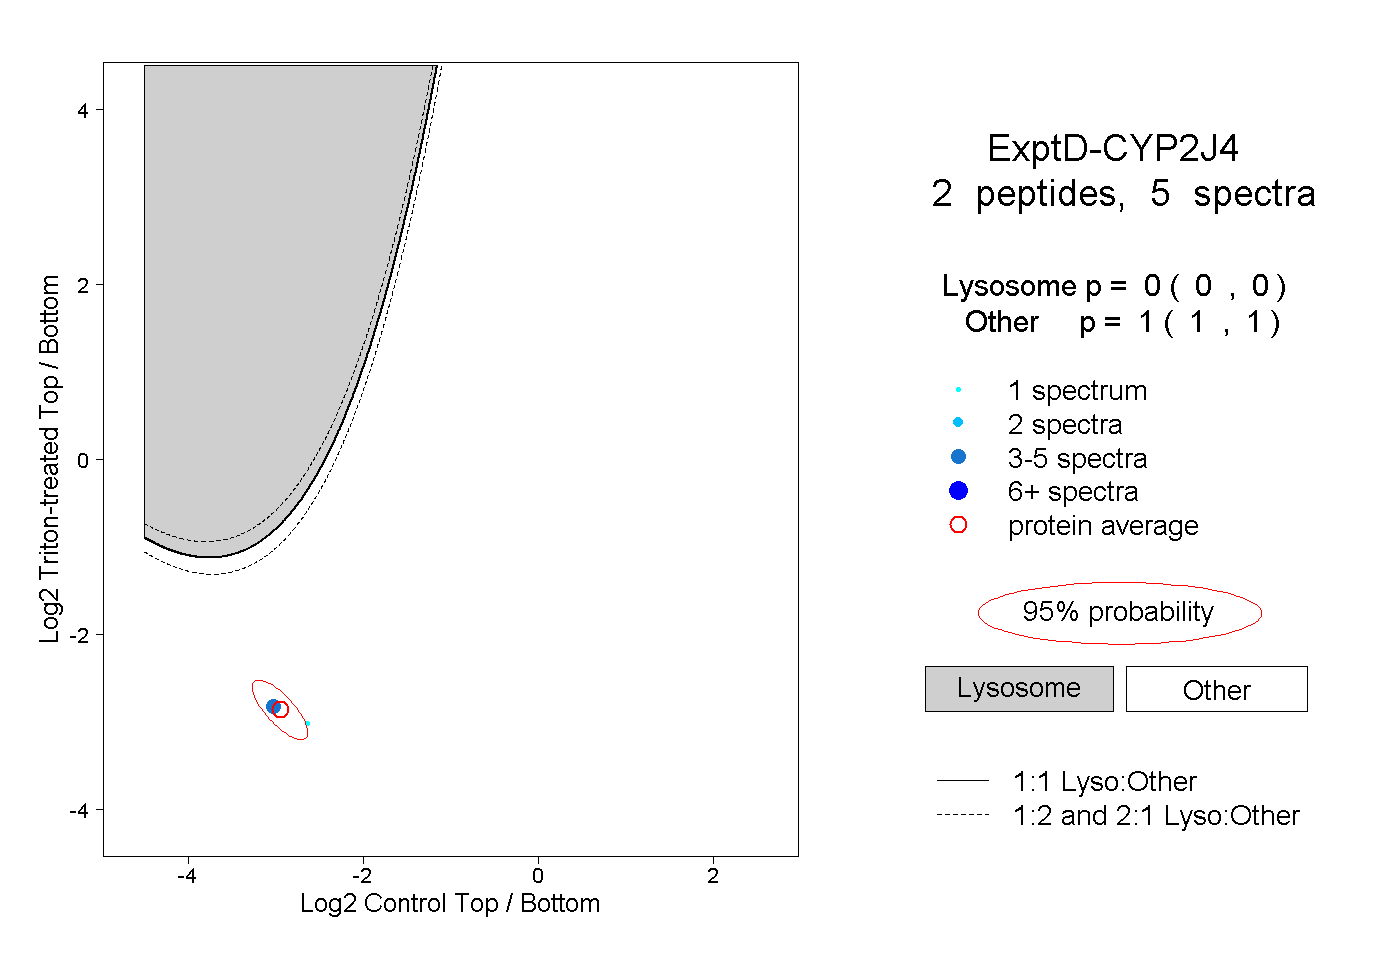
13peptides
spectra
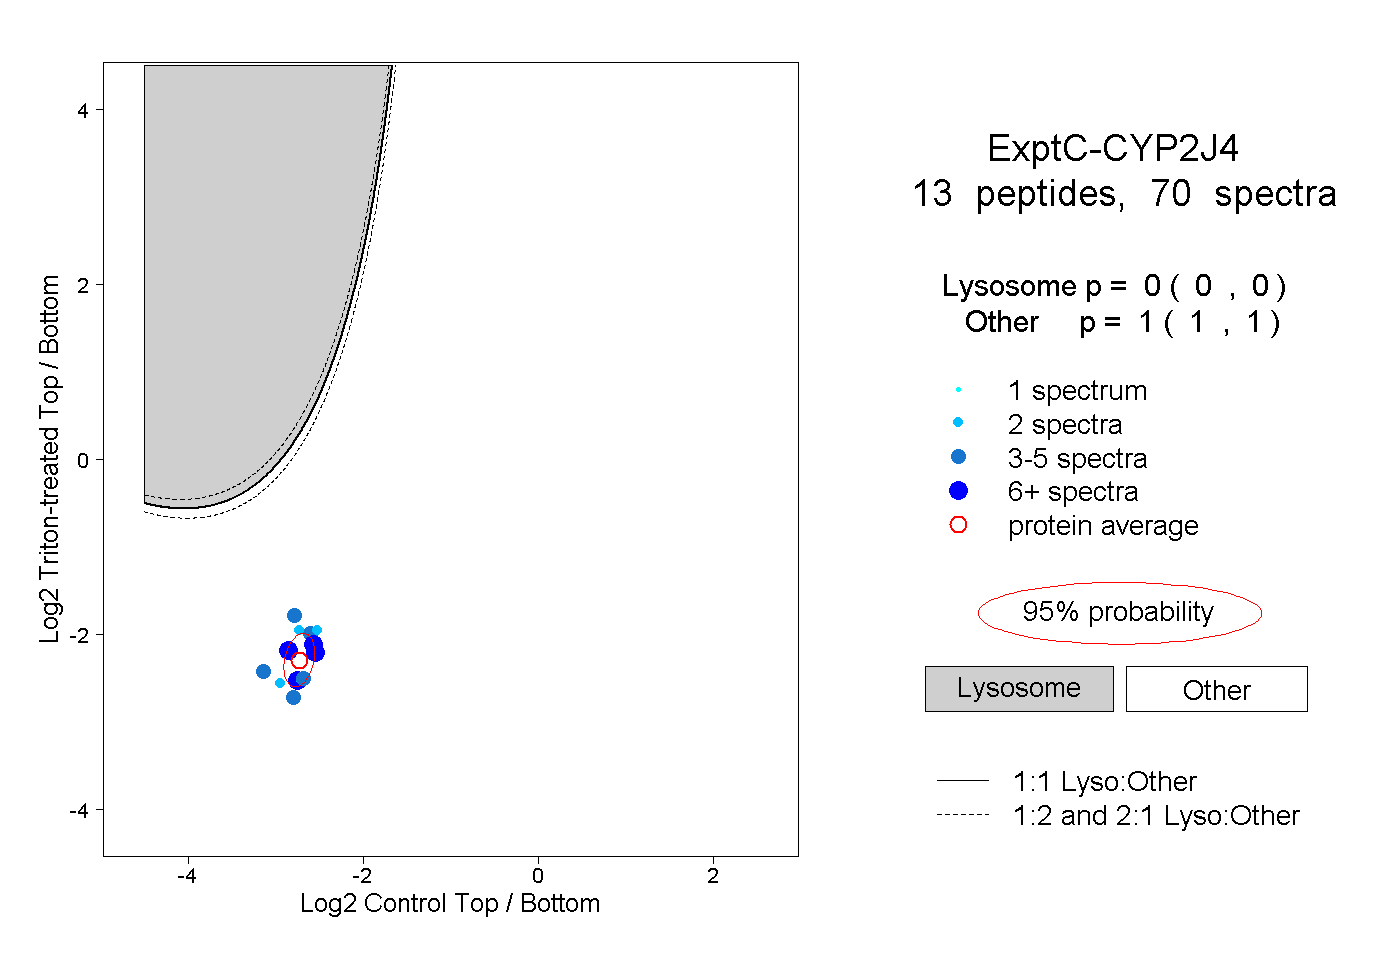
0.000 | 0.000
1.000 | 1.000