CYP2J4
[ENSRNOP00000012977]
Main page
| | | Plot |
Mito |
Lyso |
|
Perox |
ER |
Golgi |
PM |
Cytosol |
Nucleus |
|
| Expt A |
 15
15
peptides |
40
spectra |
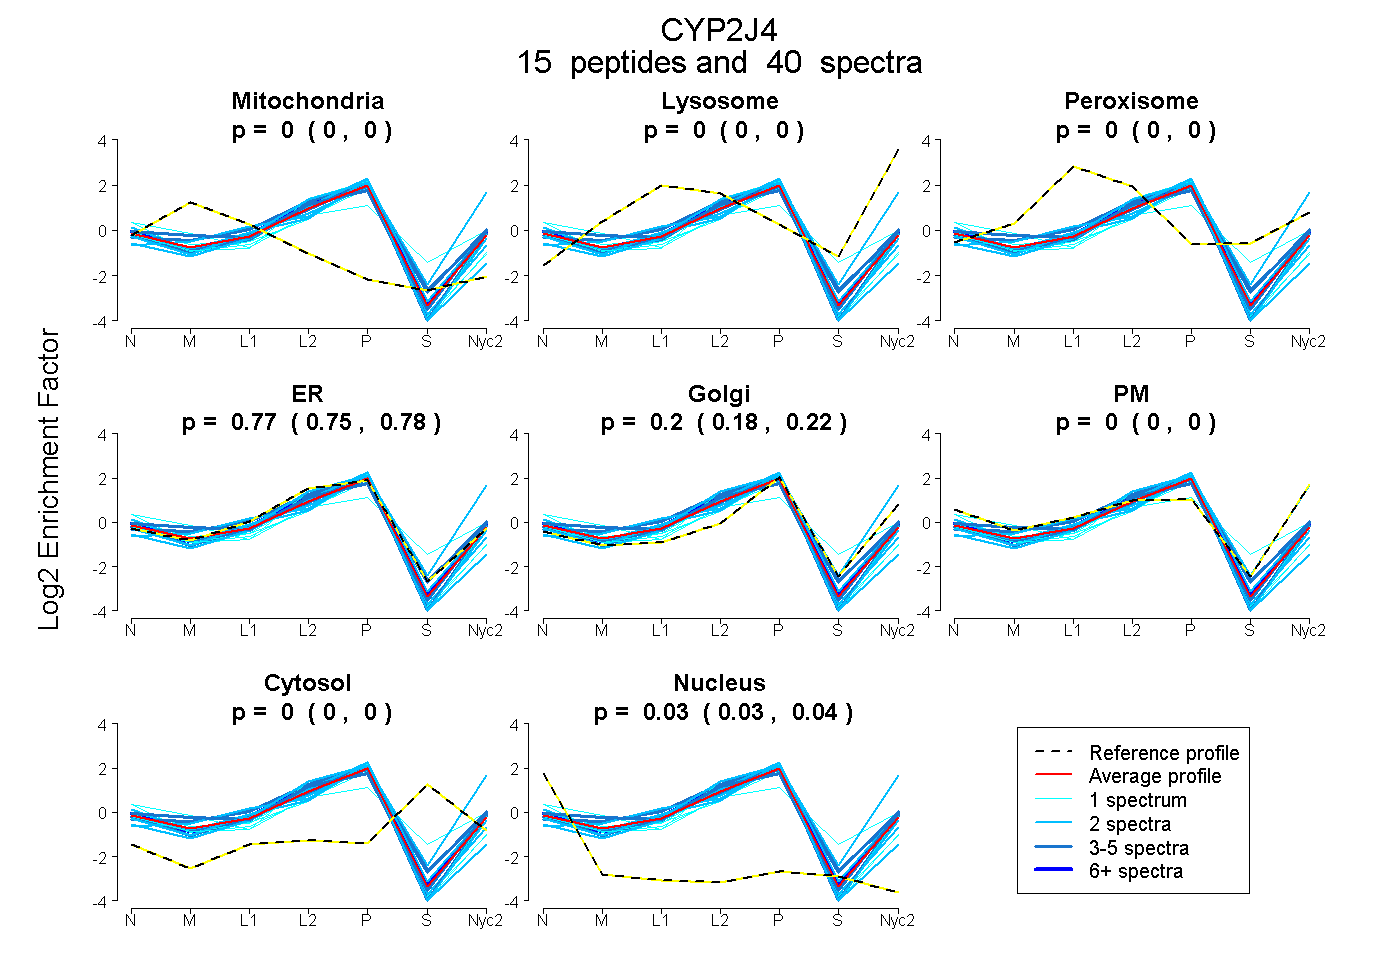 |
0.000
0.000 | 0.000 |
0.000
0.000 | 0.000 |
|
0.000
0.000 | 0.000 |
0.769
0.752 | 0.783 |
0.200
0.179 | 0.217 |
0.000
0.000 | 0.000 |
0.000
0.000 | 0.000 |
0.031
0.027 | 0.035 |
|
| | | Plot |
Mito |
|
Lyso or Perox |
|
ER |
Golgi |
PM |
Cytosol |
Nucleus |
|
| Expt B |
6
peptides |
20
spectra |
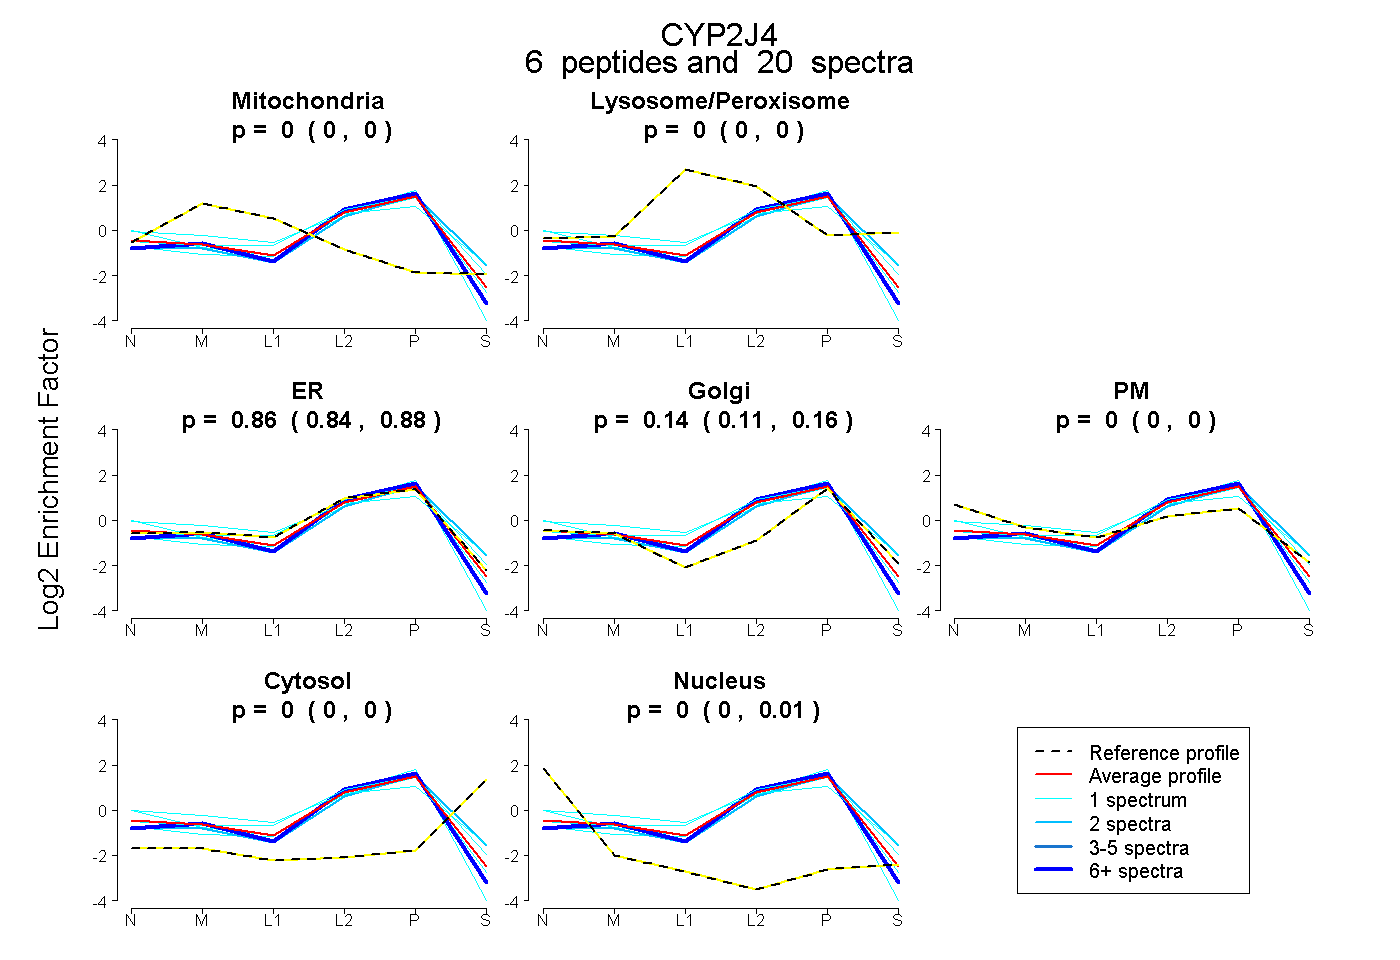 |
0.000
0.000 | 0.000 |
|
0.000
0.000 | 0.000 |
|
0.858
0.840 | 0.880 |
0.142
0.111 | 0.157 |
0.000
0.000 | 0.000 |
0.000
0.000 | 0.000 |
0.000
0.000 | 0.007 |
|
| 1 spectrum, NGLIFSSGQTWK |
0.000 |
|
0.148 |
|
0.416 |
0.124 |
0.311 |
0.000 |
0.000 |
|
| 1 spectrum, DFIDAFLK |
0.000 |
|
0.000 |
|
0.938 |
0.062 |
0.000 |
0.000 |
0.000 |
|
| 2 spectra, ESFLPFSMGK |
0.000 |
|
0.000 |
|
0.716 |
0.211 |
0.000 |
0.072 |
0.000 |
|
| 1 spectrum, NFGLGK |
0.000 |
|
0.049 |
|
0.877 |
0.073 |
0.000 |
0.000 |
0.000 |
|
| 14 spectra, FALMTLR |
0.000 |
|
0.000 |
|
0.882 |
0.118 |
0.000 |
0.000 |
0.000 |
|
| 1 spectrum, ACLGEQLAR |
0.000 |
|
0.000 |
|
0.881 |
0.051 |
0.008 |
0.000 |
0.061 |
|
| | | Plot |
|
Lyso |
|
|
|
|
|
|
|
Other |
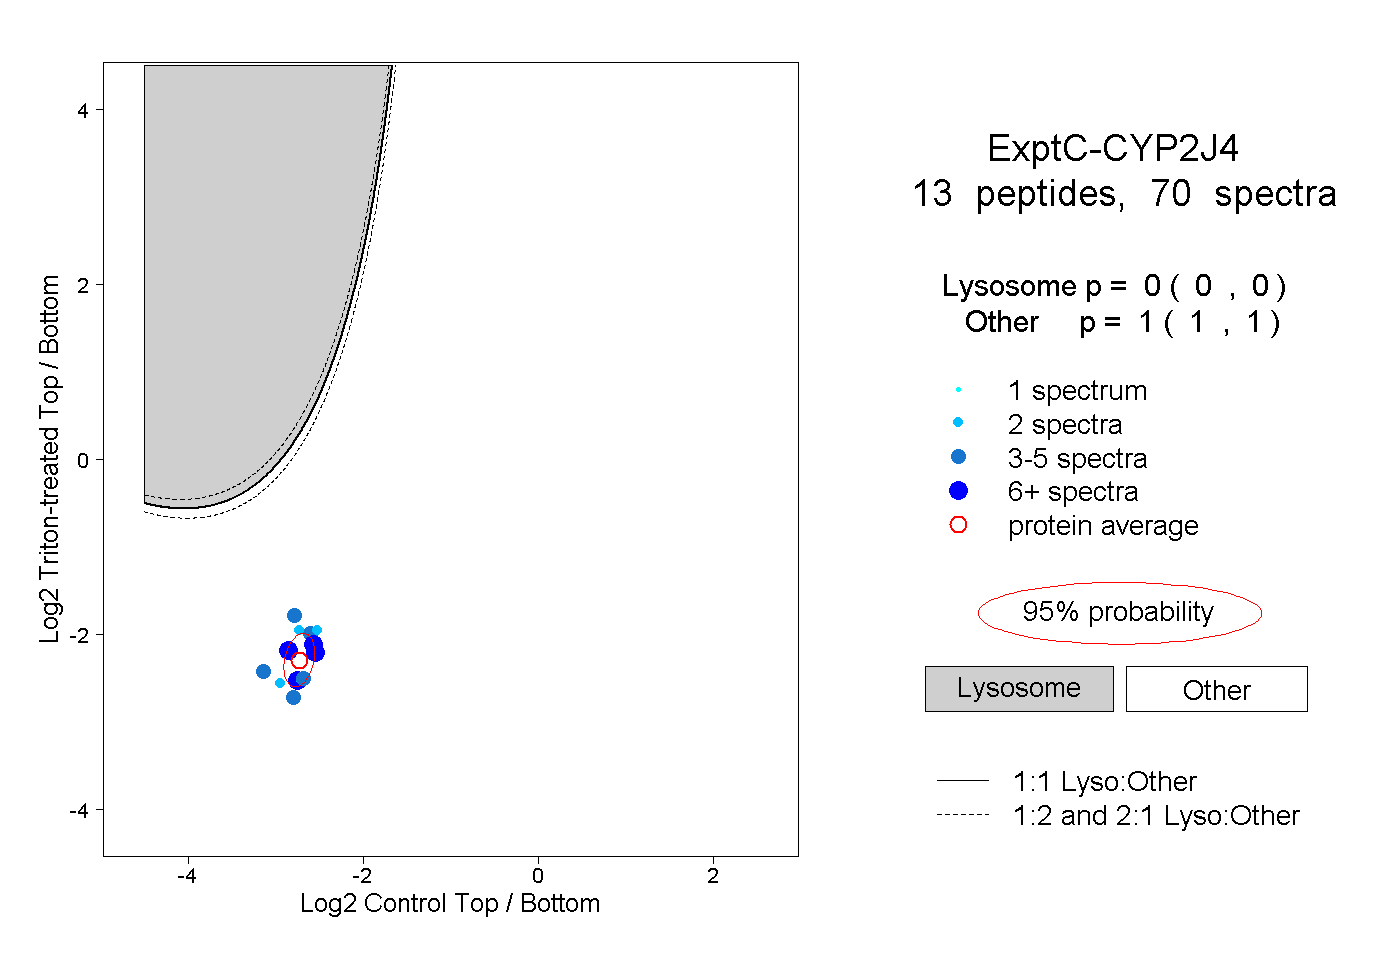
| Expt C |
13
peptides |
70
spectra |
 |
|
0.000
0.000 | 0.000 |
|
|
|
|
|
|
|
1.000
1.000 | 1.000 |
| | | Plot |
|
Lyso |
|
|
|
|
|
|
|
Other |
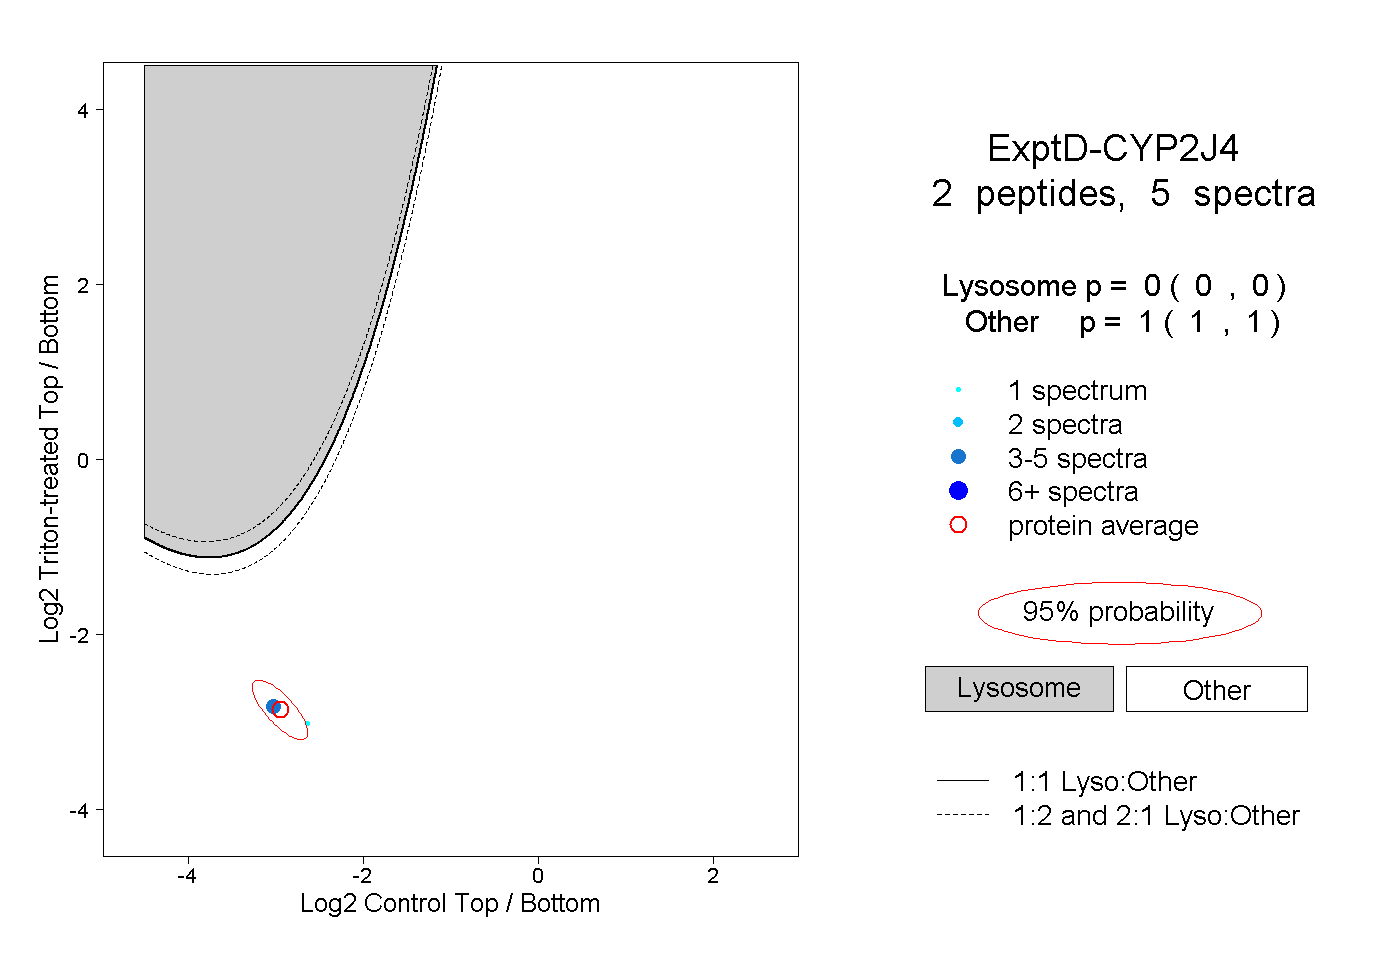
| Expt D |
2
peptides |
5
spectra |
 |
|
0.000
0.000 | 0.000 |
|
|
|
|
|
|
|
1.000
1.000 | 1.000 |