 15
15peptides
spectra
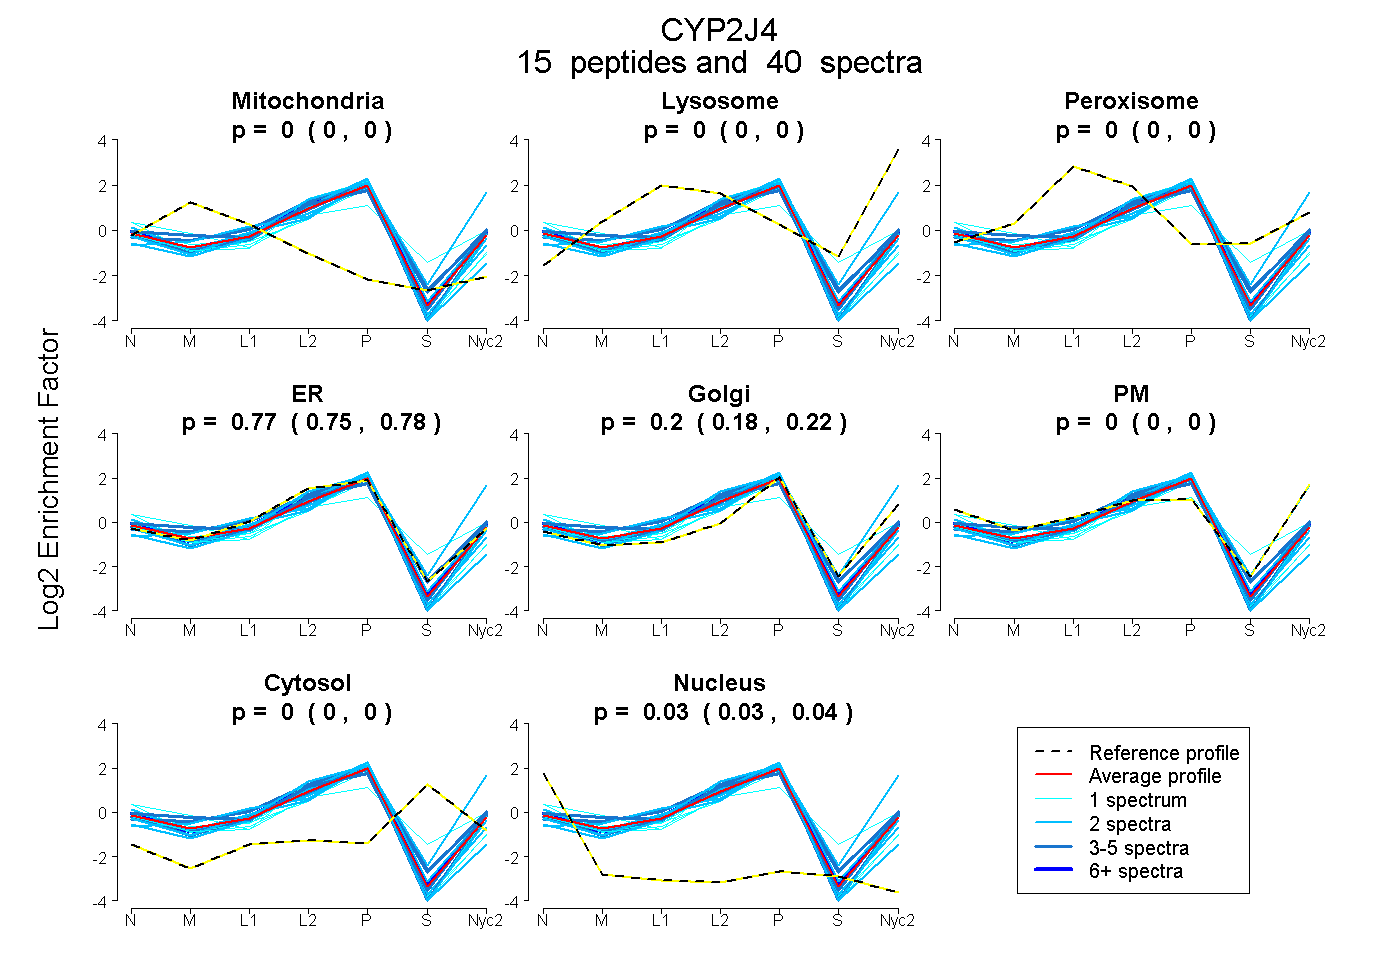
0.000 | 0.000
0.000 | 0.000
0.000 | 0.000
0.752 | 0.783
0.179 | 0.217
0.000 | 0.000
0.000 | 0.000
0.027 | 0.035
| Plot | Mito | Lyso | Perox | ER | Golgi | PM | Cytosol | Nucleus | |||||
| Expt A |
15 peptides |
40 spectra |
|
0.000 0.000 | 0.000 |
0.000 0.000 | 0.000 |
0.000 0.000 | 0.000 |
0.769 0.752 | 0.783 |
0.200 0.179 | 0.217 |
0.000 0.000 | 0.000 |
0.000 0.000 | 0.000 |
0.031 0.027 | 0.035 |
| 2 spectra, NGLIFSSGQTWK | 0.000 | 0.000 | 0.000 | 0.977 | 0.000 | 0.000 | 0.000 | 0.023 | ||
| 1 spectrum, MGNIIPLNVPR | 0.000 | 0.000 | 0.000 | 0.820 | 0.159 | 0.000 | 0.000 | 0.021 | ||
| 2 spectra, ICAVPR | 0.000 | 0.000 | 0.000 | 0.883 | 0.000 | 0.000 | 0.000 | 0.117 | ||
| 1 spectrum, ETFTHIEQNILNRPLSVMQER | 0.000 | 0.000 | 0.000 | 0.797 | 0.086 | 0.000 | 0.000 | 0.118 | ||
| 8 spectra, DFIDAFLK | 0.000 | 0.000 | 0.000 | 0.810 | 0.163 | 0.007 | 0.000 | 0.021 | ||
| 2 spectra, MQEEAHYLVEAIR | 0.000 | 0.000 | 0.000 | 0.685 | 0.315 | 0.000 | 0.000 | 0.000 | ||
| 2 spectra, GTMVLTNLTALHR | 0.000 | 0.266 | 0.000 | 0.107 | 0.604 | 0.023 | 0.000 | 0.000 | ||
| 4 spectra, FALMTLR | 0.018 | 0.000 | 0.000 | 0.929 | 0.045 | 0.007 | 0.000 | 0.000 | ||
| 1 spectrum, ACLGEQLAR | 0.000 | 0.000 | 0.000 | 0.844 | 0.000 | 0.000 | 0.000 | 0.156 | ||
| 5 spectra, FQEMLR | 0.000 | 0.000 | 0.000 | 0.707 | 0.283 | 0.002 | 0.000 | 0.009 | ||
| 1 spectrum, ESFLPFSMGK | 0.000 | 0.000 | 0.000 | 0.728 | 0.213 | 0.039 | 0.000 | 0.020 | ||
| 4 spectra, NFGLGK | 0.059 | 0.000 | 0.000 | 0.711 | 0.120 | 0.110 | 0.000 | 0.000 | ||
| 1 spectrum, ESMPYTNAVIHEVQR | 0.087 | 0.000 | 0.000 | 0.327 | 0.121 | 0.316 | 0.143 | 0.006 | ||
| 2 spectra, EWATPDVFNPEHFLENGQFK | 0.000 | 0.000 | 0.000 | 0.876 | 0.037 | 0.000 | 0.000 | 0.087 | ||
| 4 spectra, DWNPEEPR | 0.000 | 0.000 | 0.000 | 0.689 | 0.292 | 0.000 | 0.000 | 0.019 |
| Plot | Mito | Lyso or Perox | ER | Golgi | PM | Cytosol | Nucleus | ||||||
| Expt B |
6 peptides |
20 spectra |
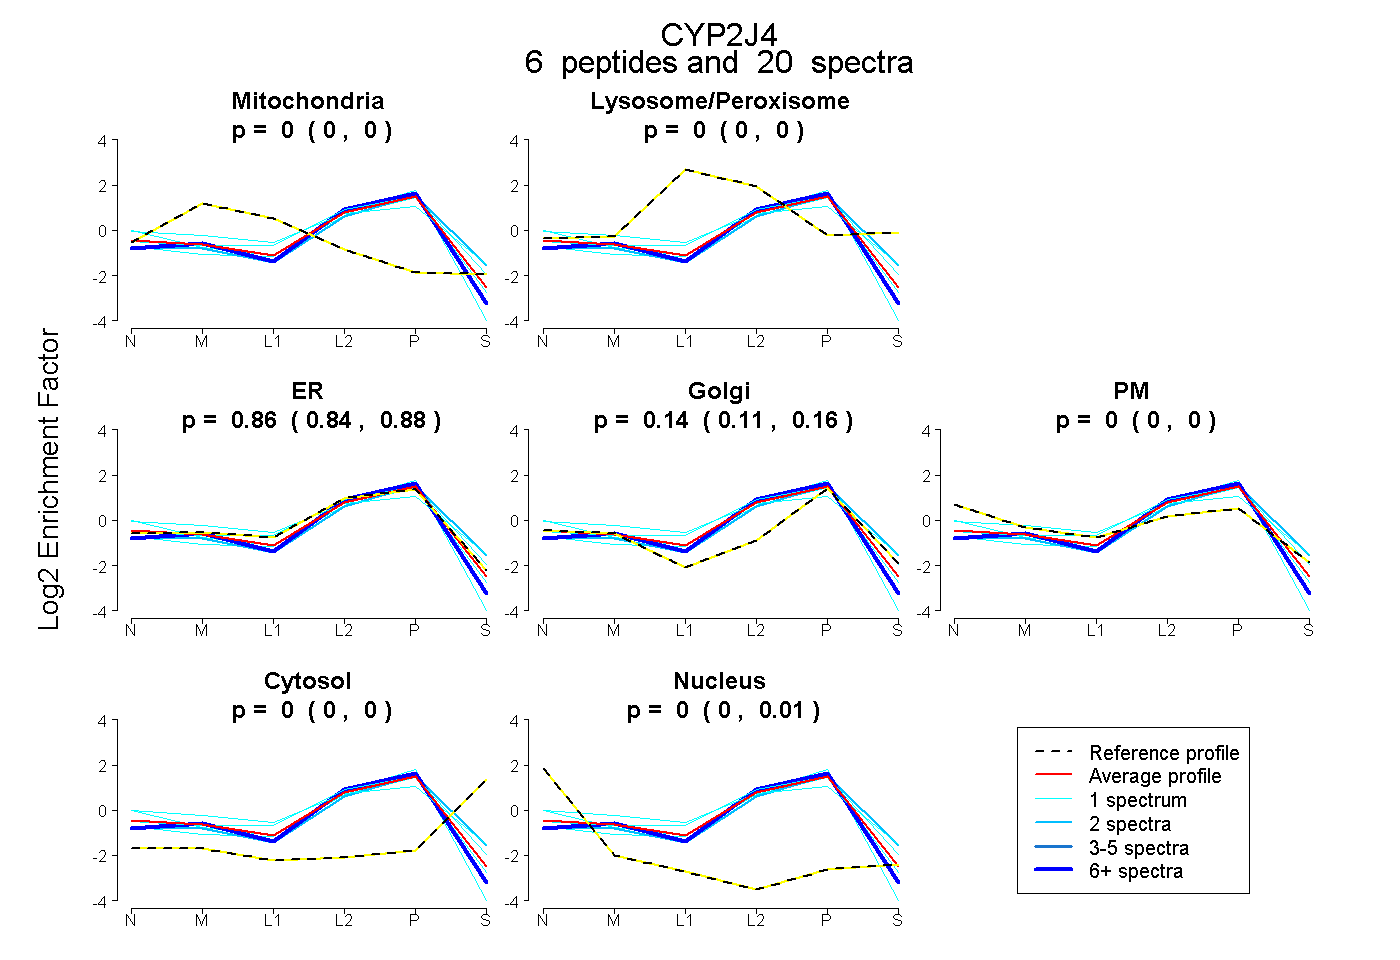 |
0.000 0.000 | 0.000 |
0.000 0.000 | 0.000 |
0.858 0.840 | 0.880 |
0.142 0.111 | 0.157 |
0.000 0.000 | 0.000 |
0.000 0.000 | 0.000 |
0.000 0.000 | 0.007 |
|||
| Plot | Lyso | Other | |||||||||||
| Expt C |
13 peptides |
70 spectra |
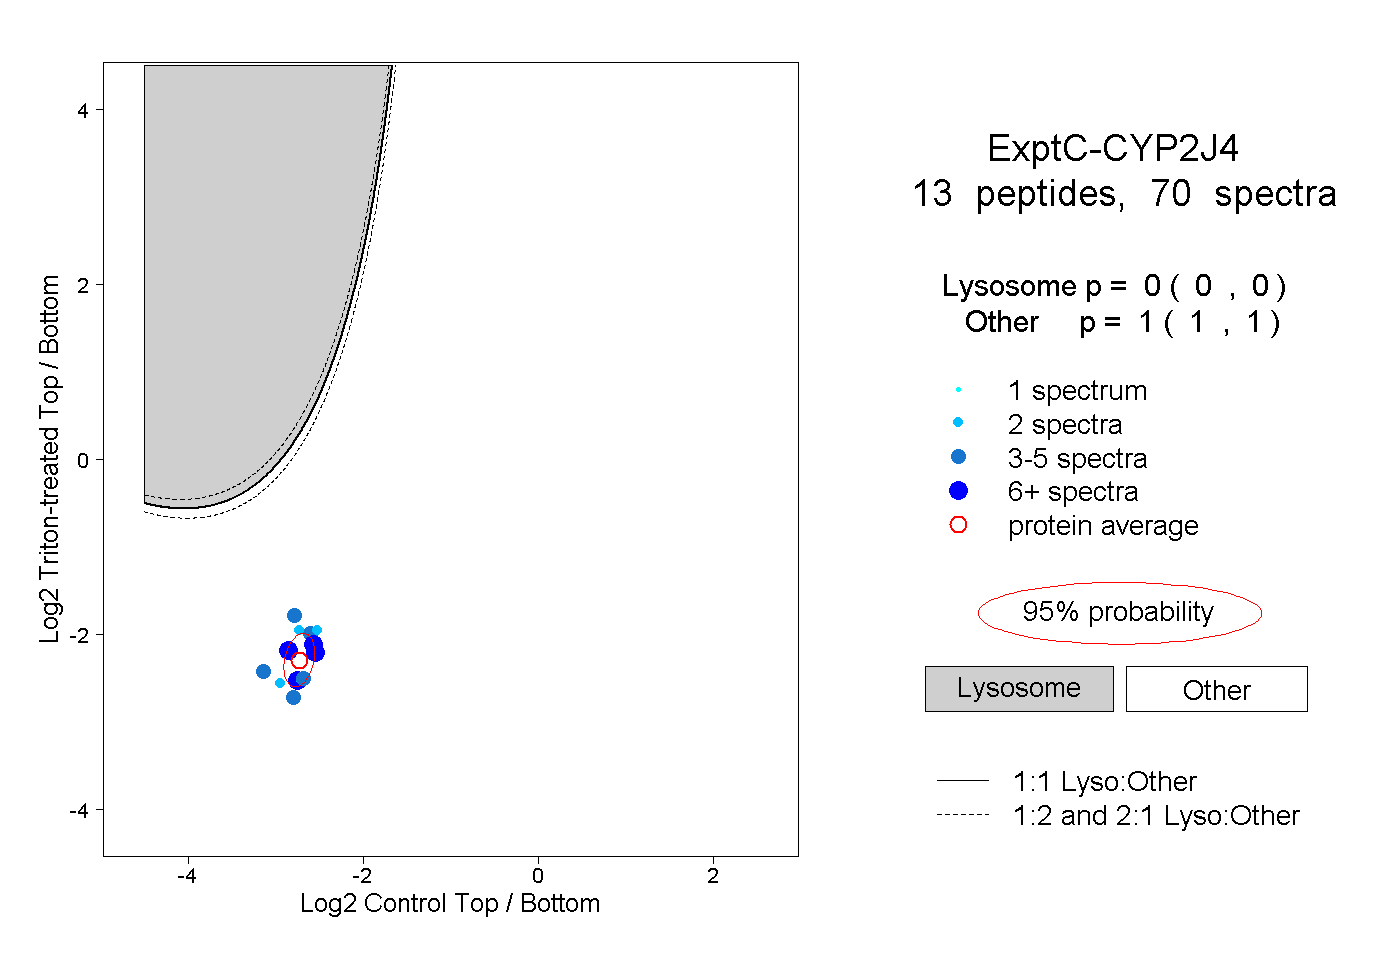 |
0.000 0.000 | 0.000 |
1.000 1.000 | 1.000 |
||||||||
| Plot | Lyso | Other | |||||||||||
| Expt D |
2 peptides |
5 spectra |
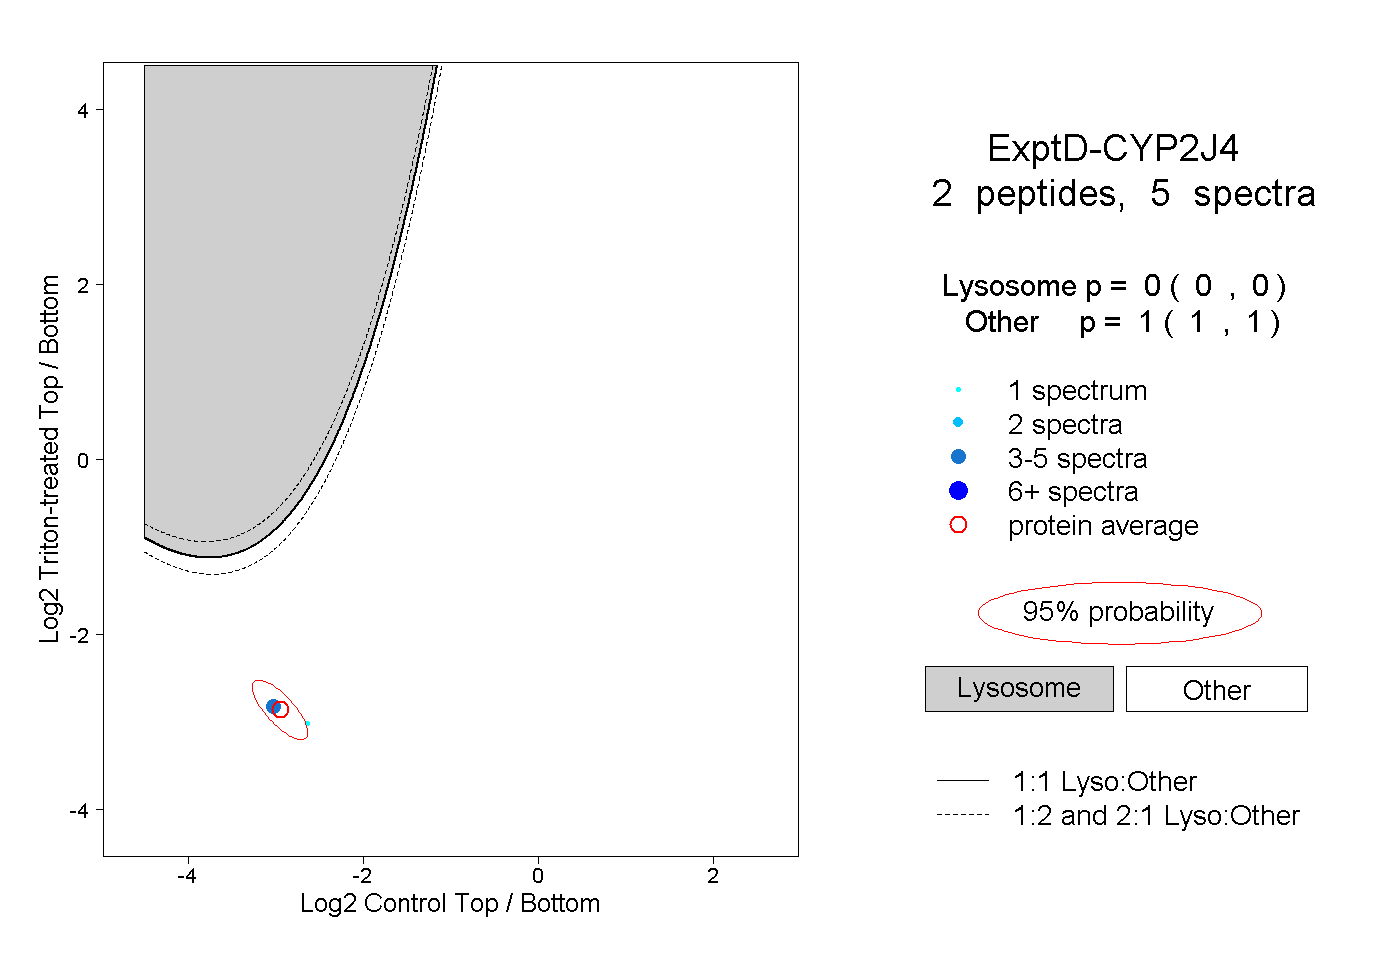 |
0.000 0.000 | 0.000 |
1.000 1.000 | 1.000 |