 2
2peptides
spectra
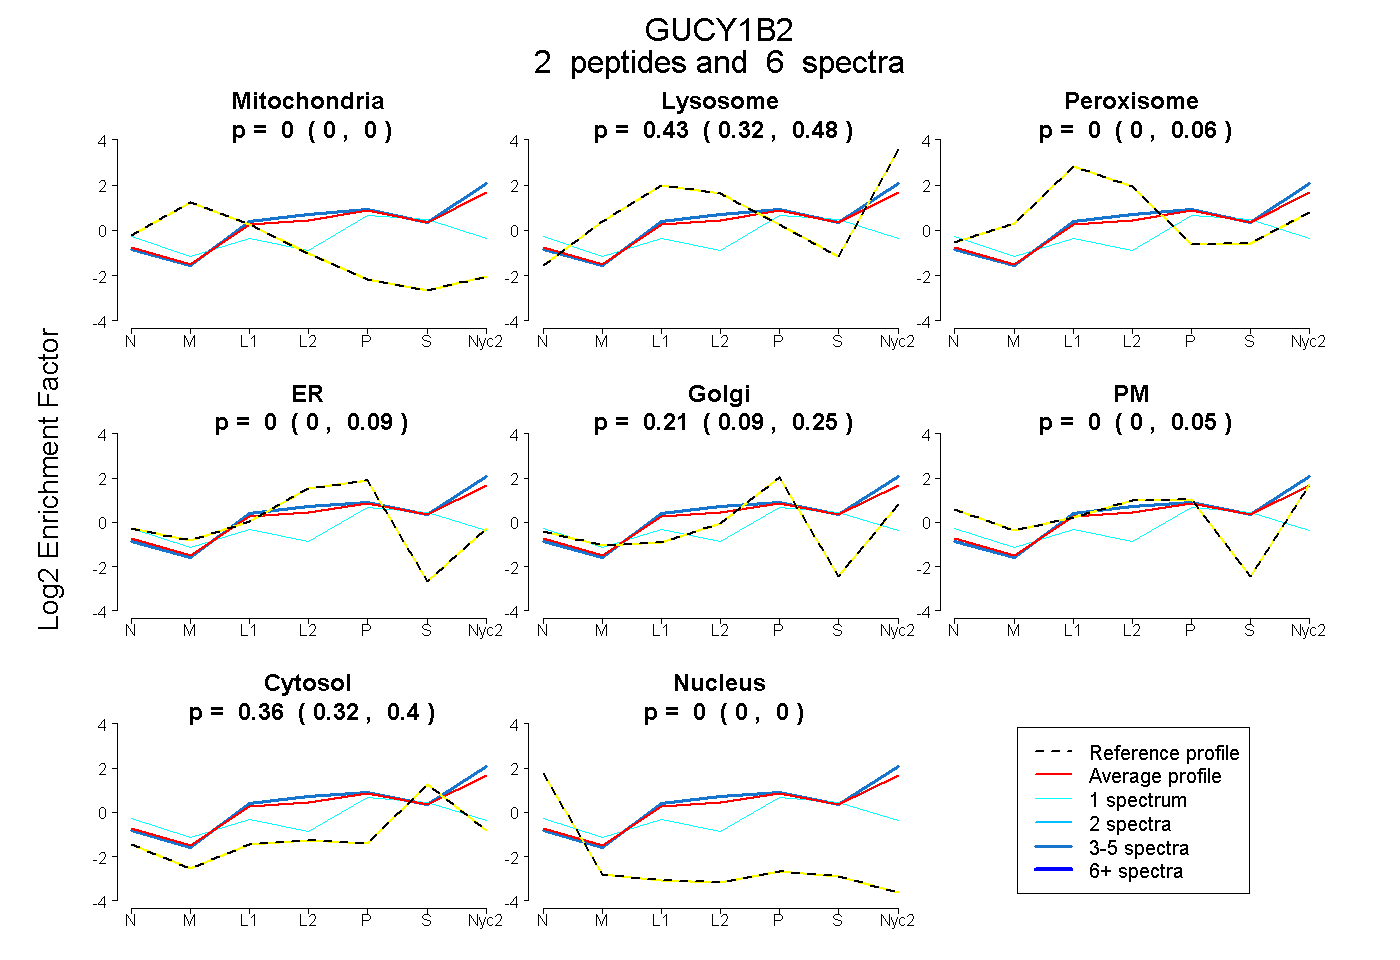
0.000 | 0.000
0.316 | 0.479
0.000 | 0.064
0.000 | 0.085
0.092 | 0.251
0.000 | 0.054
0.320 | 0.397
0.000 | 0.000
1peptide
spectrum
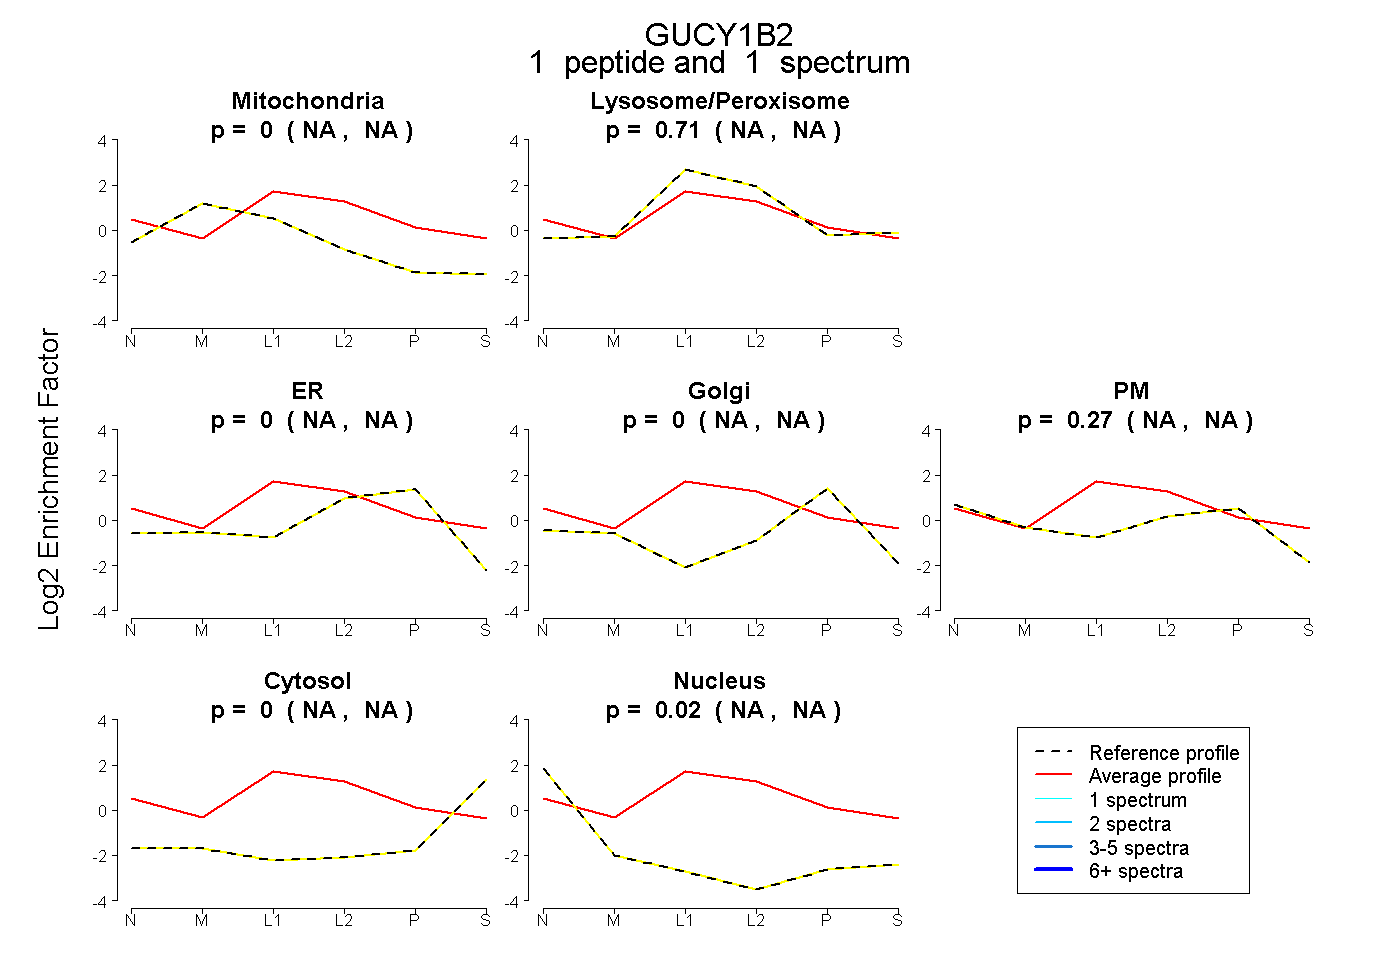
NA | NA
NA | NA
NA | NA
NA | NA
NA | NA
NA | NA
NA | NA
1peptide
spectra
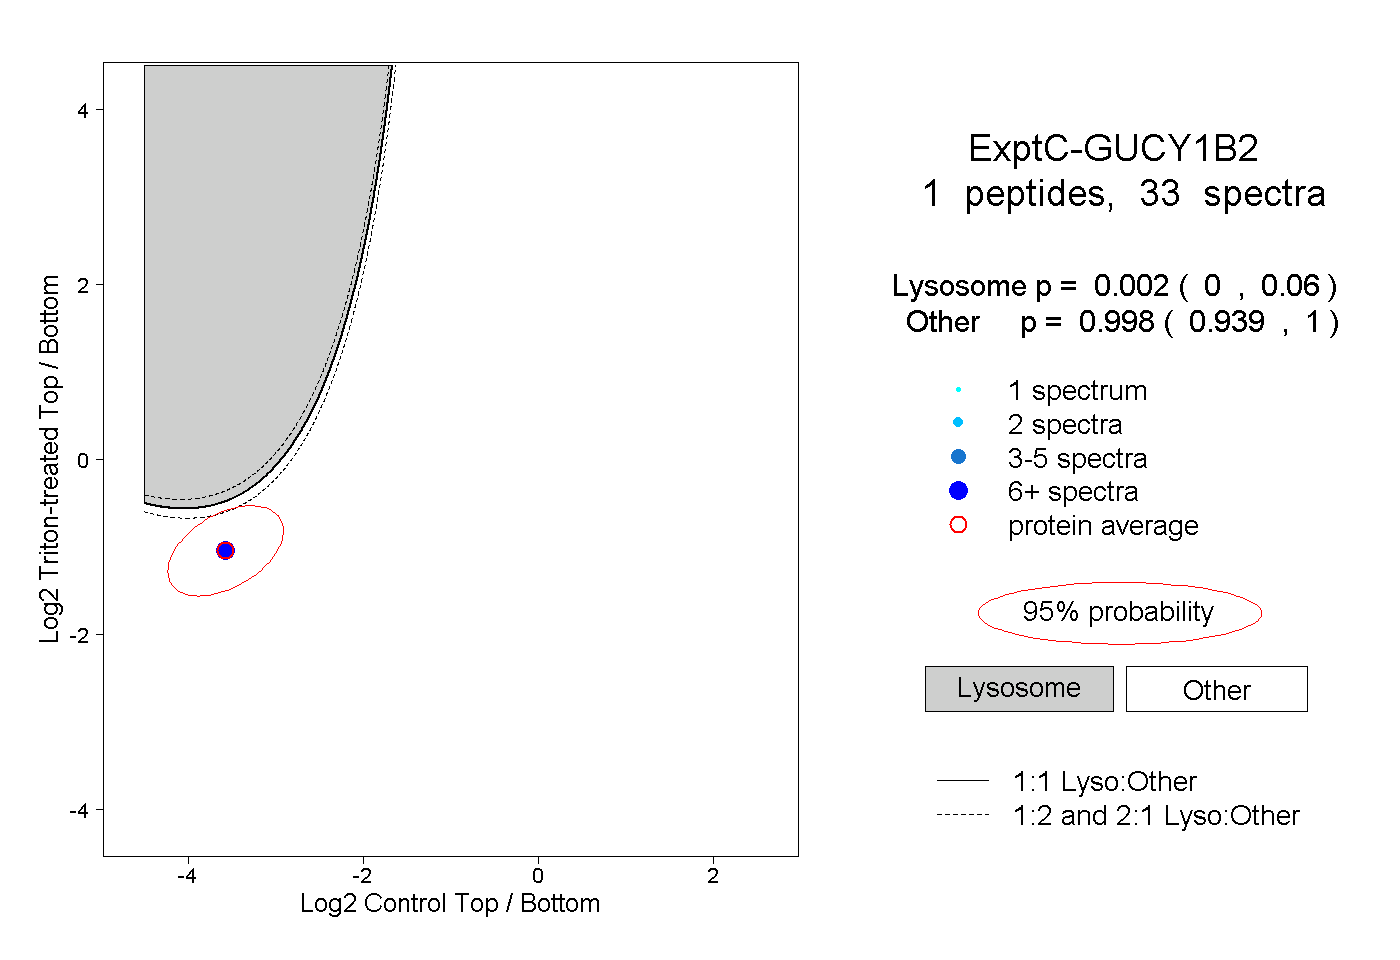
0.000 | 0.060
0.939 | 1.000
1peptide
spectra
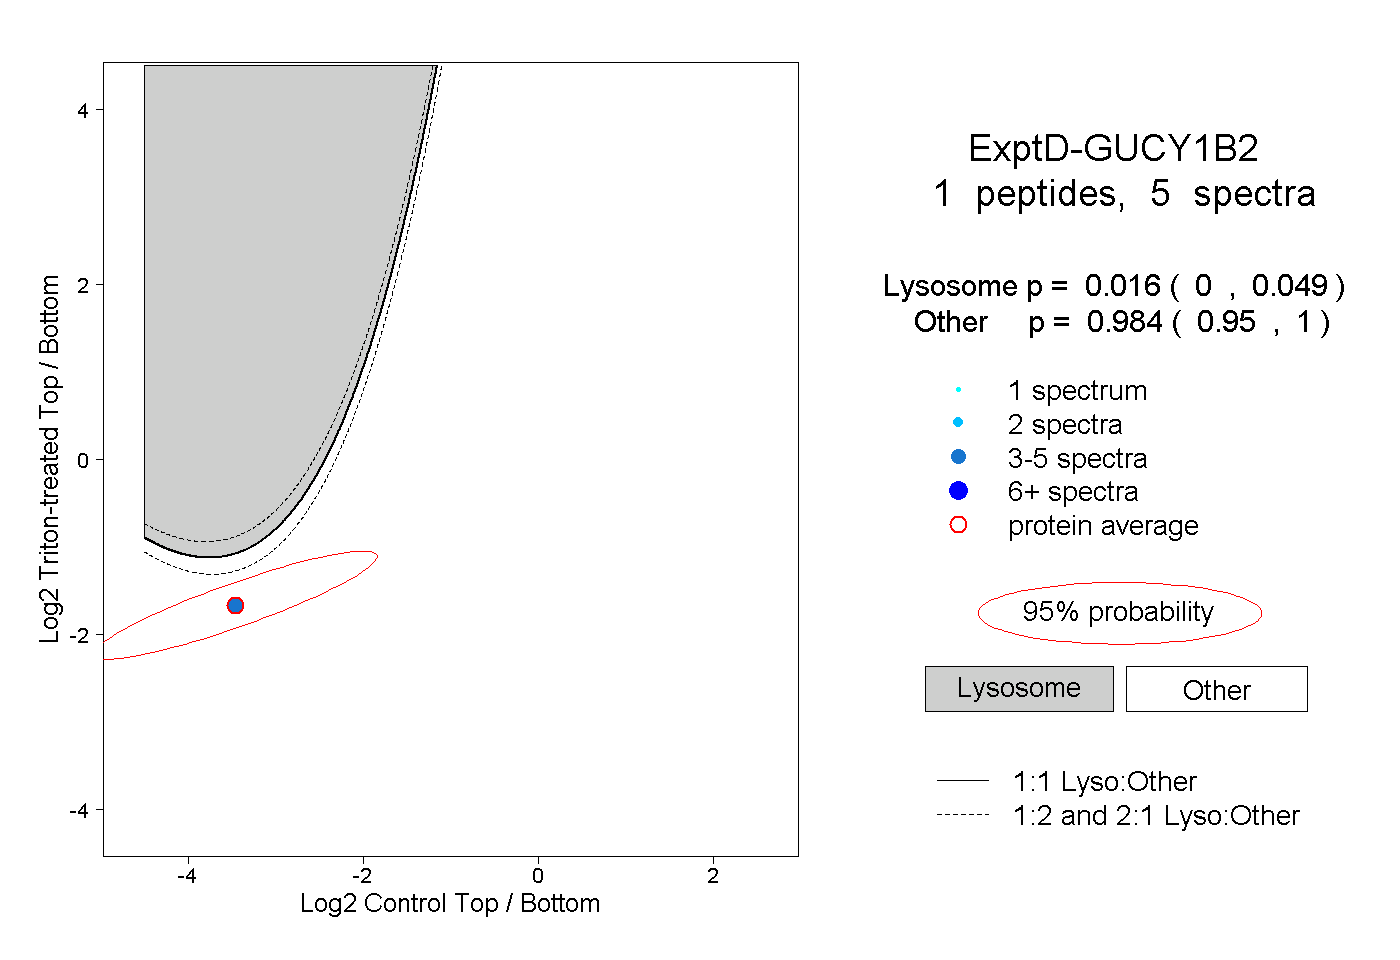
0.000 | 0.049
0.950 | 1.000