 11
11peptides
spectra
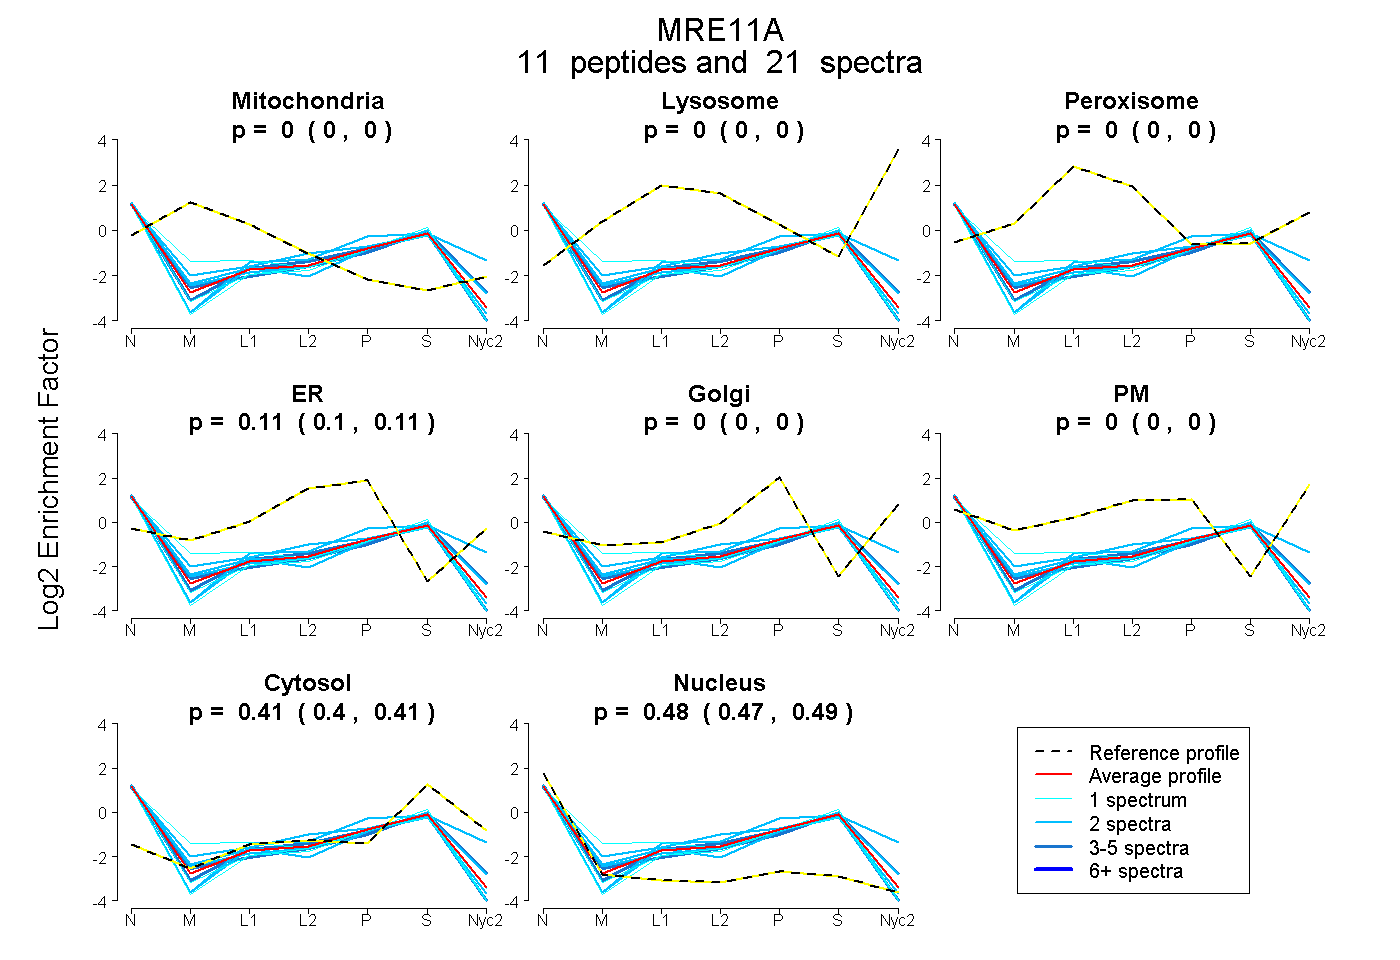
0.000 | 0.000
0.000 | 0.000
0.000 | 0.000
0.102 | 0.114
0.000 | 0.000
0.000 | 0.000
0.403 | 0.415
0.474 | 0.490
3peptides
spectra
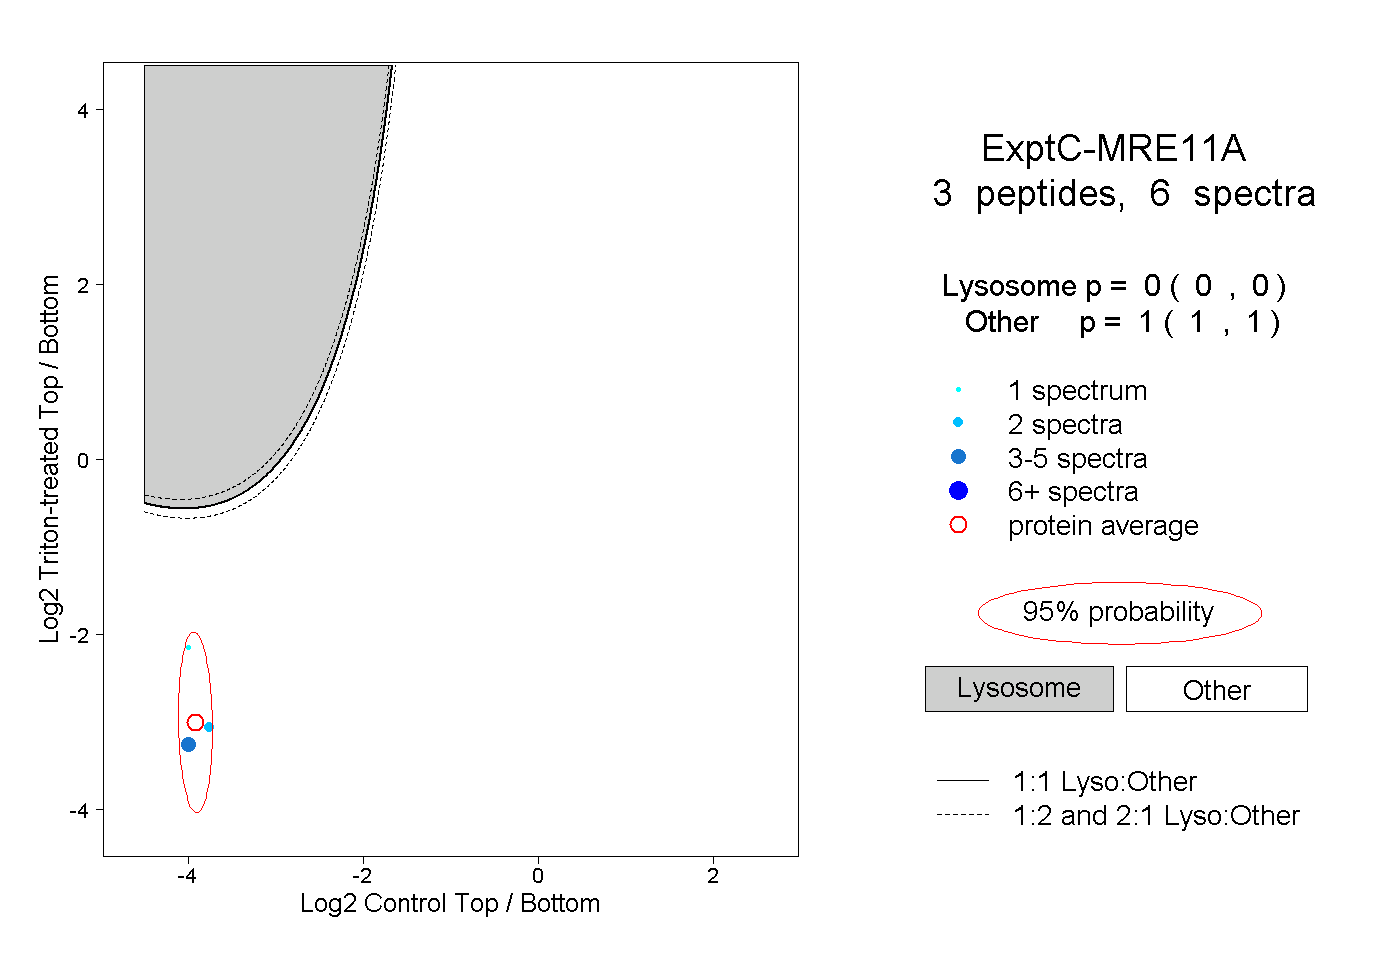
0.000 | 0.000
1.000 | 1.000
1peptide
spectrum
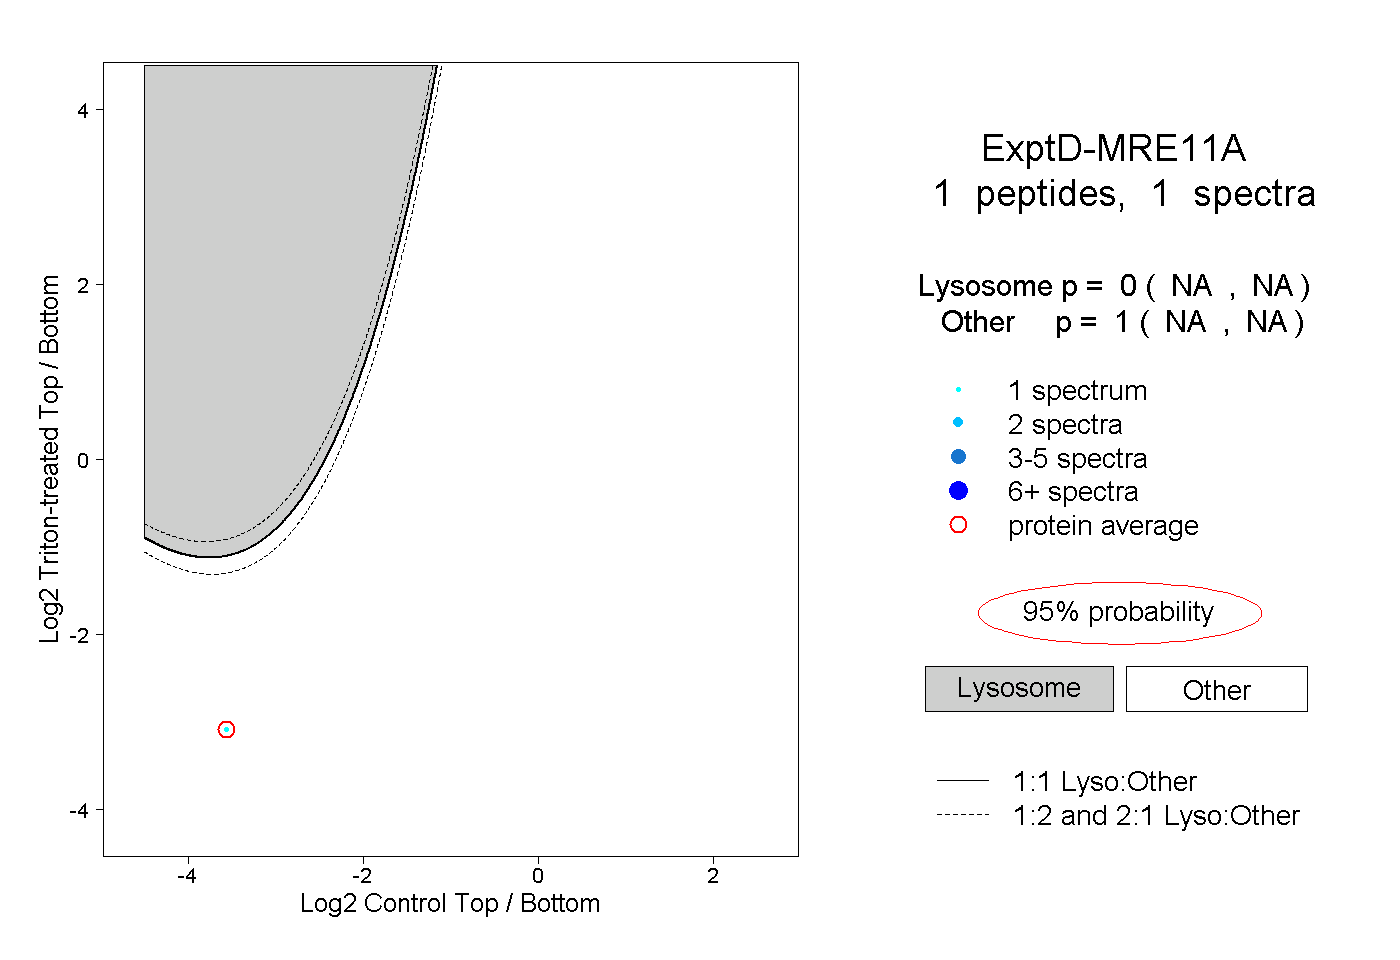
NA | NA
NA | NA