 5
5peptides
spectra
0.000 | 0.000
0.000 | 0.000
0.000 | 0.039
0.111 | 0.210
0.000 | 0.000
0.177 | 0.269
0.568 | 0.616
0.000 | 0.000
1peptide
spectra
NA | NA
NA | NA
| Plot | Mito | Lyso | Perox | ER | Golgi | PM | Cytosol | Nucleus | |||||
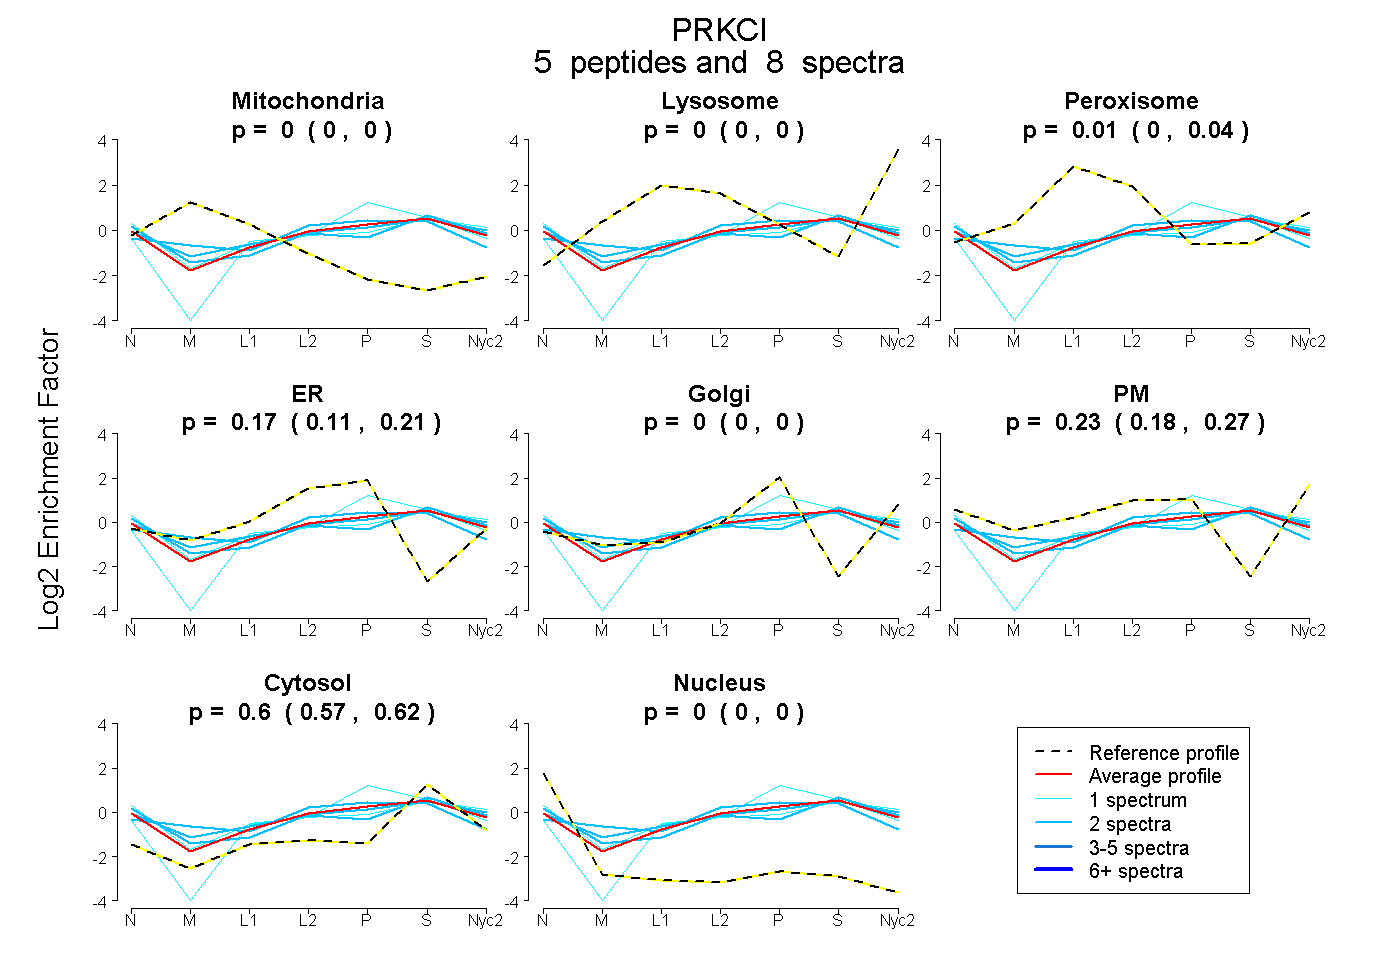
| Expt A |
5 peptides |
8 spectra |
|
0.000 0.000 | 0.000 |
0.000 0.000 | 0.000 |
0.009 0.000 | 0.039 |
0.167 0.111 | 0.210 |
0.000 0.000 | 0.000 |
0.228 0.177 | 0.269 |
0.596 0.568 | 0.616 |
0.000 0.000 | 0.000 |
||
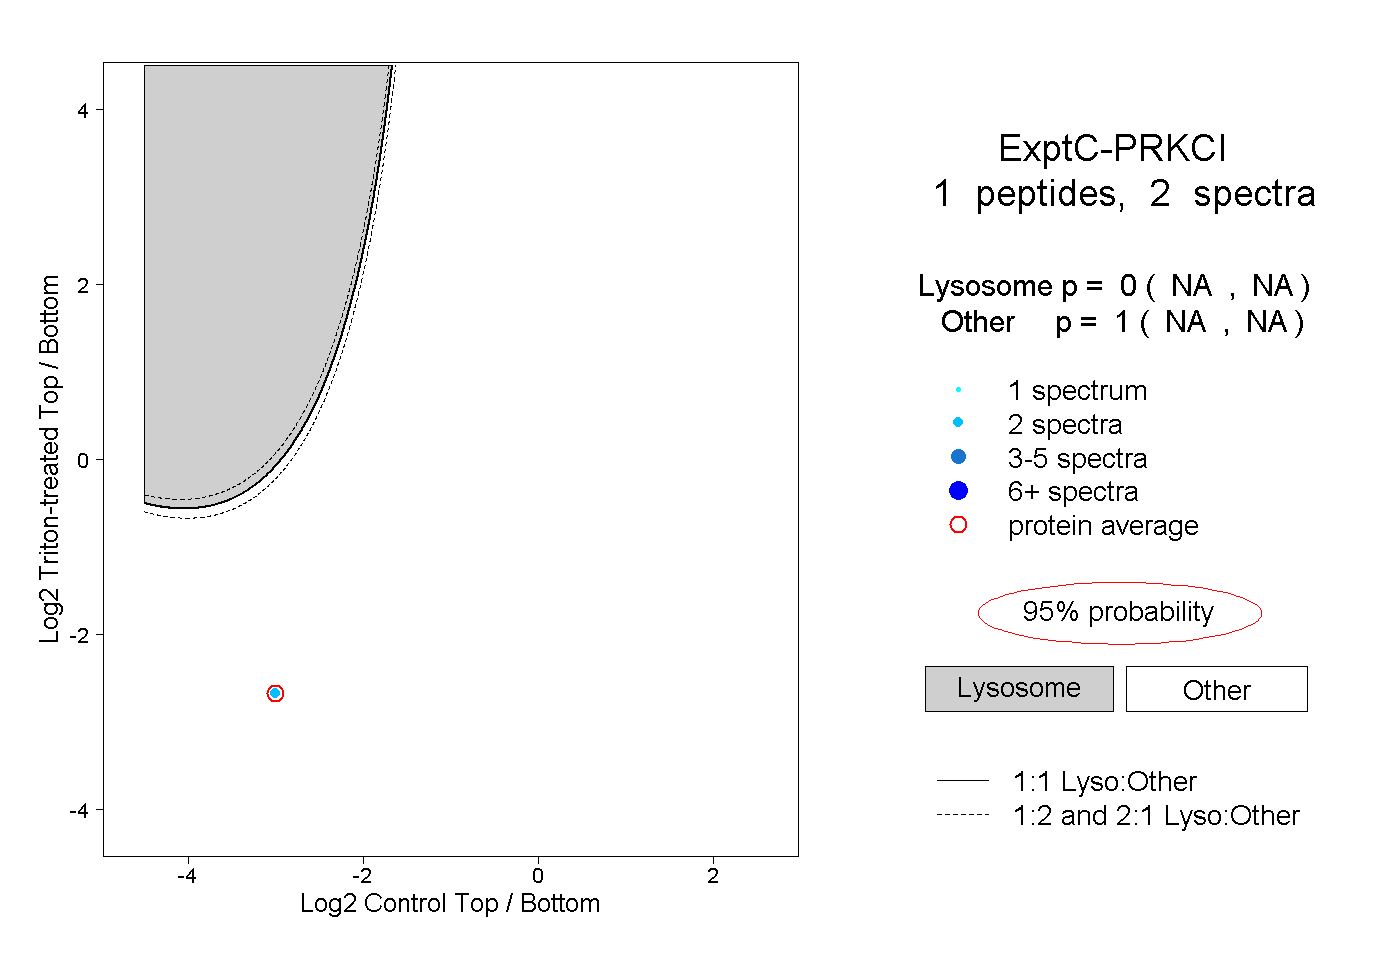
| Plot | Lyso | Other | |||||||||||
| Expt C |
1 peptide |
2 spectra |
|
0.000 NA | NA |
1.000 NA | NA |