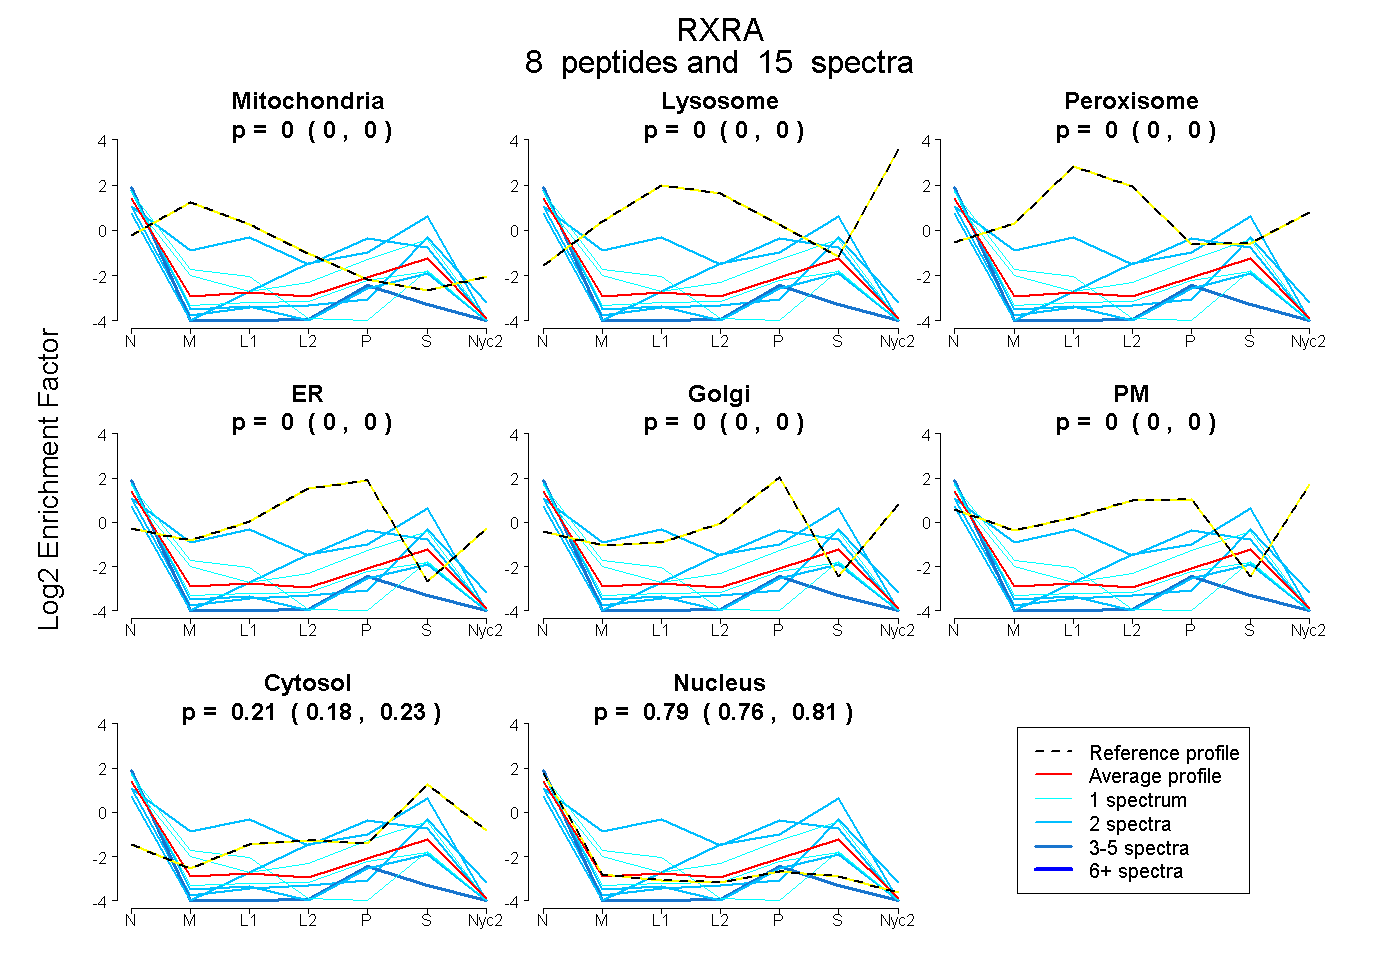
 8
8peptides
spectra
0.000 | 0.000
0.000 | 0.000
0.000 | 0.000
0.000 | 0.000
0.000 | 0.000
0.000 | 0.000
0.184 | 0.231
0.764 | 0.813
| Plot | Mito | Lyso | Perox | ER | Golgi | PM | Cytosol | Nucleus | |||||
| Expt A |
8 peptides |
15 spectra |
|
0.000 0.000 | 0.000 |
0.000 0.000 | 0.000 |
0.000 0.000 | 0.000 |
0.000 0.000 | 0.000 |
0.000 0.000 | 0.000 |
0.000 0.000 | 0.000 |
0.209 0.184 | 0.231 |
0.791 0.764 | 0.813 |
| 1 spectrum, VLTELVSK | 0.000 | 0.000 | 0.000 | 0.000 | 0.000 | 0.000 | 0.088 | 0.912 | ||
| 2 spectra, GLSNPAEVEALR | 0.000 | 0.000 | 0.000 | 0.000 | 0.000 | 0.000 | 0.023 | 0.977 | ||
| 4 spectra, CLEHLFFFK | 0.000 | 0.000 | 0.000 | 0.000 | 0.000 | 0.000 | 0.000 | 1.000 | ||
| 1 spectrum, QLFTLVEWAK | 0.142 | 0.000 | 0.000 | 0.000 | 0.000 | 0.000 | 0.000 | 0.858 | ||
| 1 spectrum, VYASLEAYCK | 0.000 | 0.000 | 0.000 | 0.013 | 0.000 | 0.000 | 0.335 | 0.652 | ||
| 2 spectra, DGILLATGLHVHR | 0.000 | 0.000 | 0.000 | 0.000 | 0.000 | 0.000 | 0.520 | 0.480 | ||
| 2 spectra, AIVLFNPDSK | 0.000 | 0.000 | 0.000 | 0.000 | 0.000 | 0.000 | 0.292 | 0.708 | ||
| 2 spectra, ILEAELAVEPK | 0.261 | 0.000 | 0.055 | 0.151 | 0.000 | 0.000 | 0.153 | 0.380 |
| Plot | Mito | Lyso or Perox | ER | Golgi | PM | Cytosol | Nucleus | ||||||
| Expt B |
4 peptides |
5 spectra |
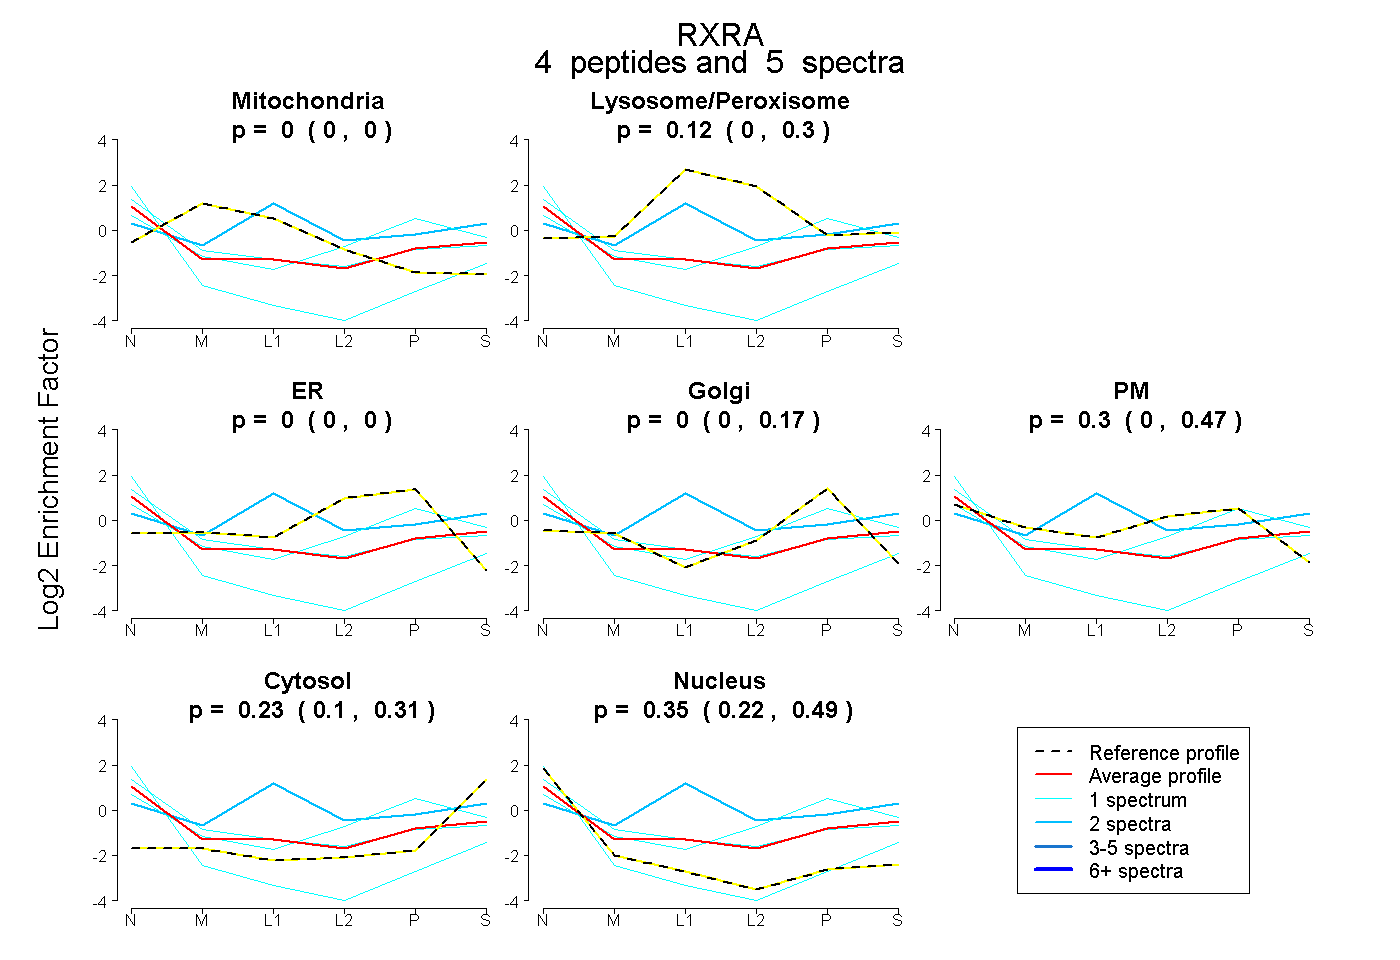 |
0.000 0.000 | 0.000 |
0.118 0.000 | 0.303 |
0.000 0.000 | 0.000 |
0.000 0.000 | 0.168 |
0.299 0.000 | 0.471 |
0.232 0.096 | 0.310 |
0.351 0.222 | 0.487 |