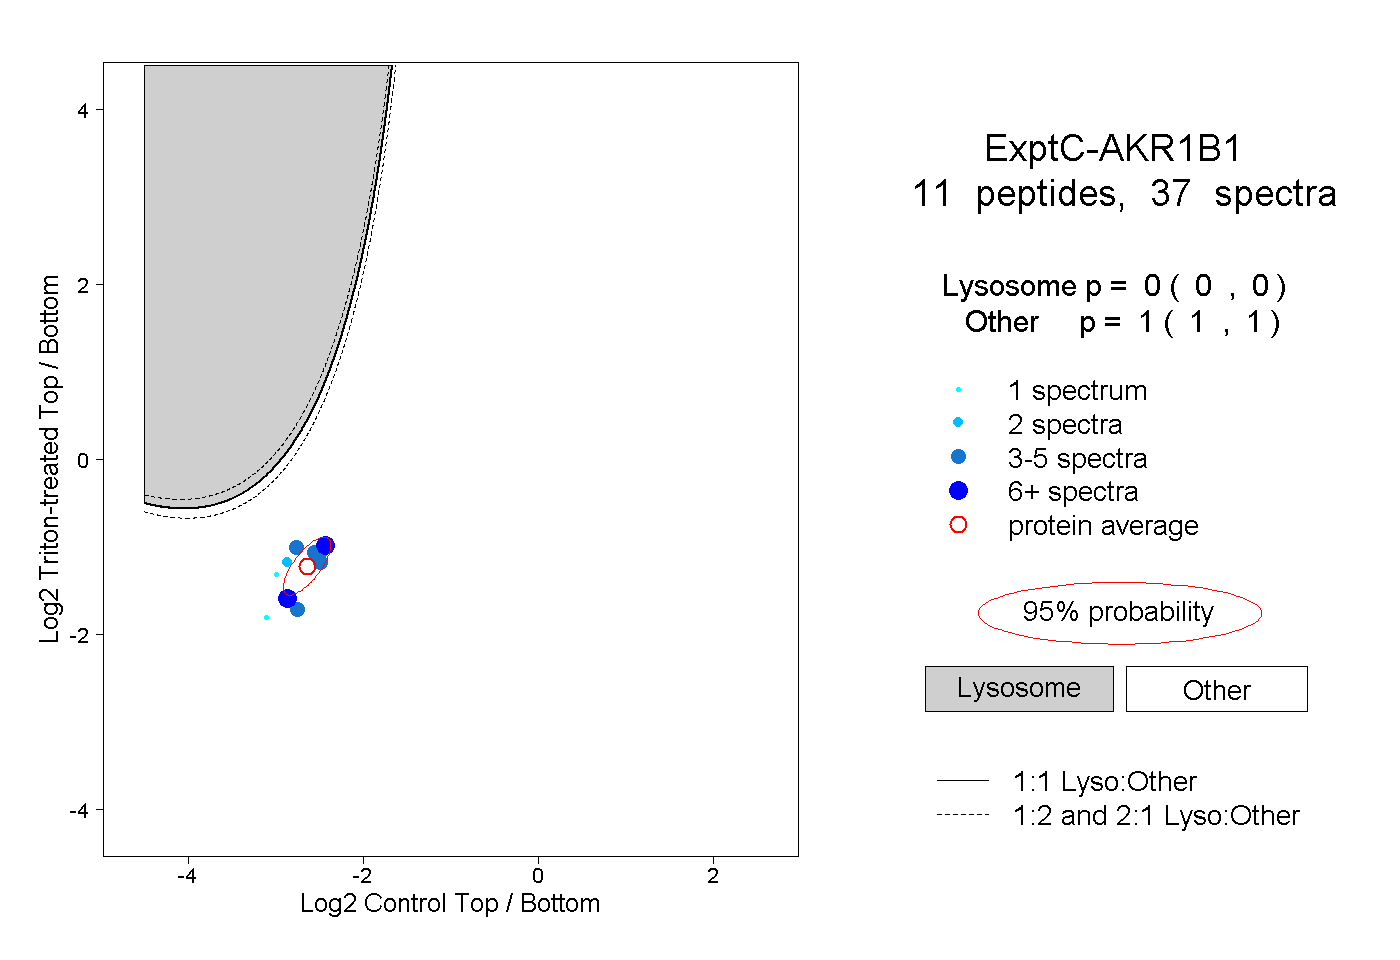
11
11peptides
spectra
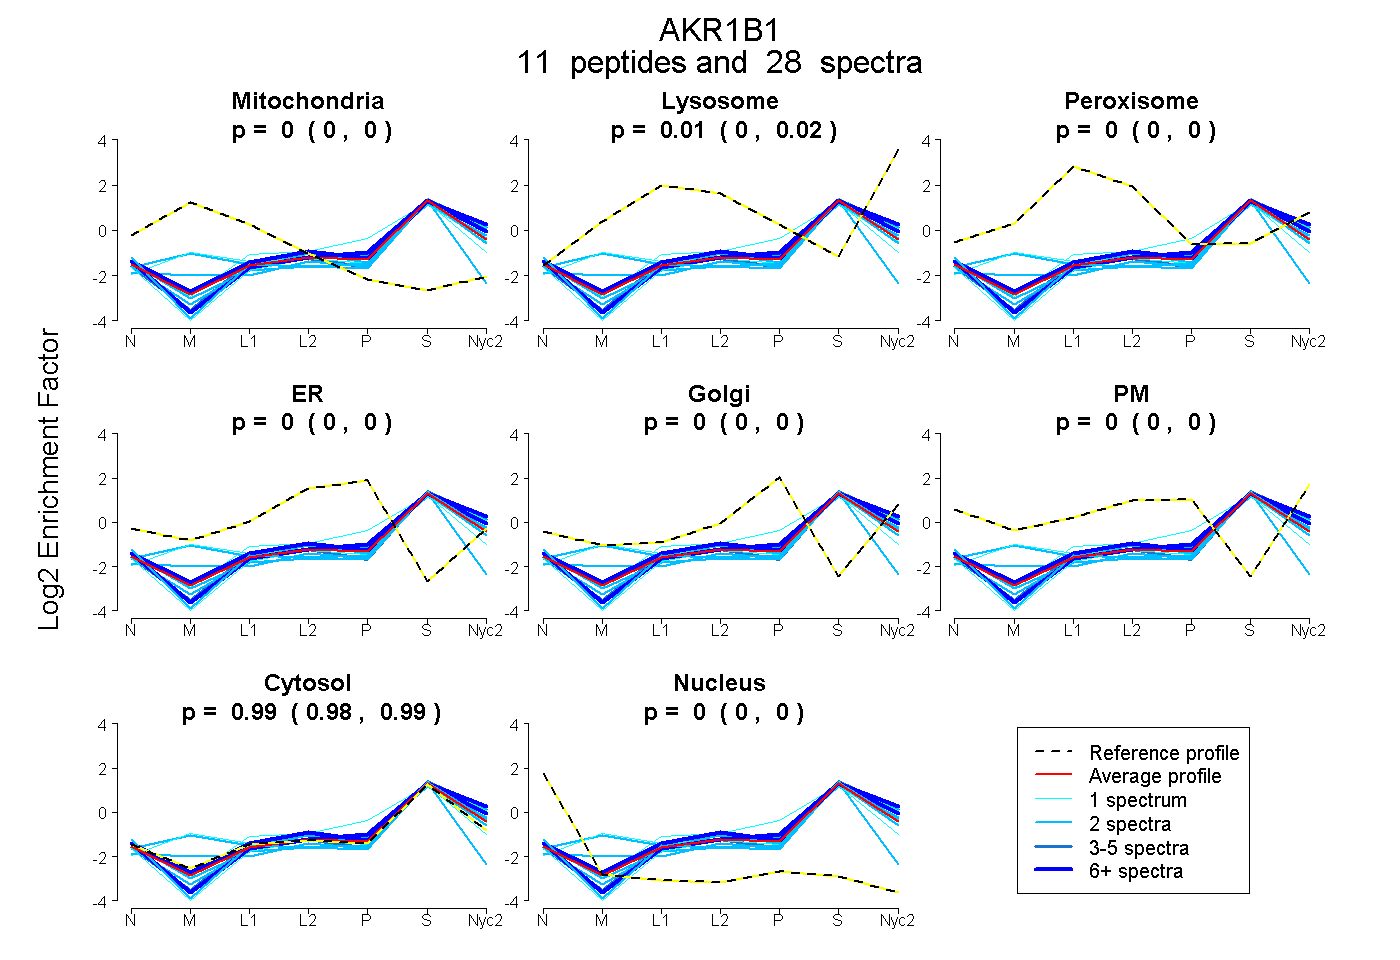
0.000 | 0.000
0.005 | 0.022
0.000 | 0.000
0.000 | 0.000
0.000 | 0.000
0.000 | 0.000
0.977 | 0.993
0.000 | 0.000
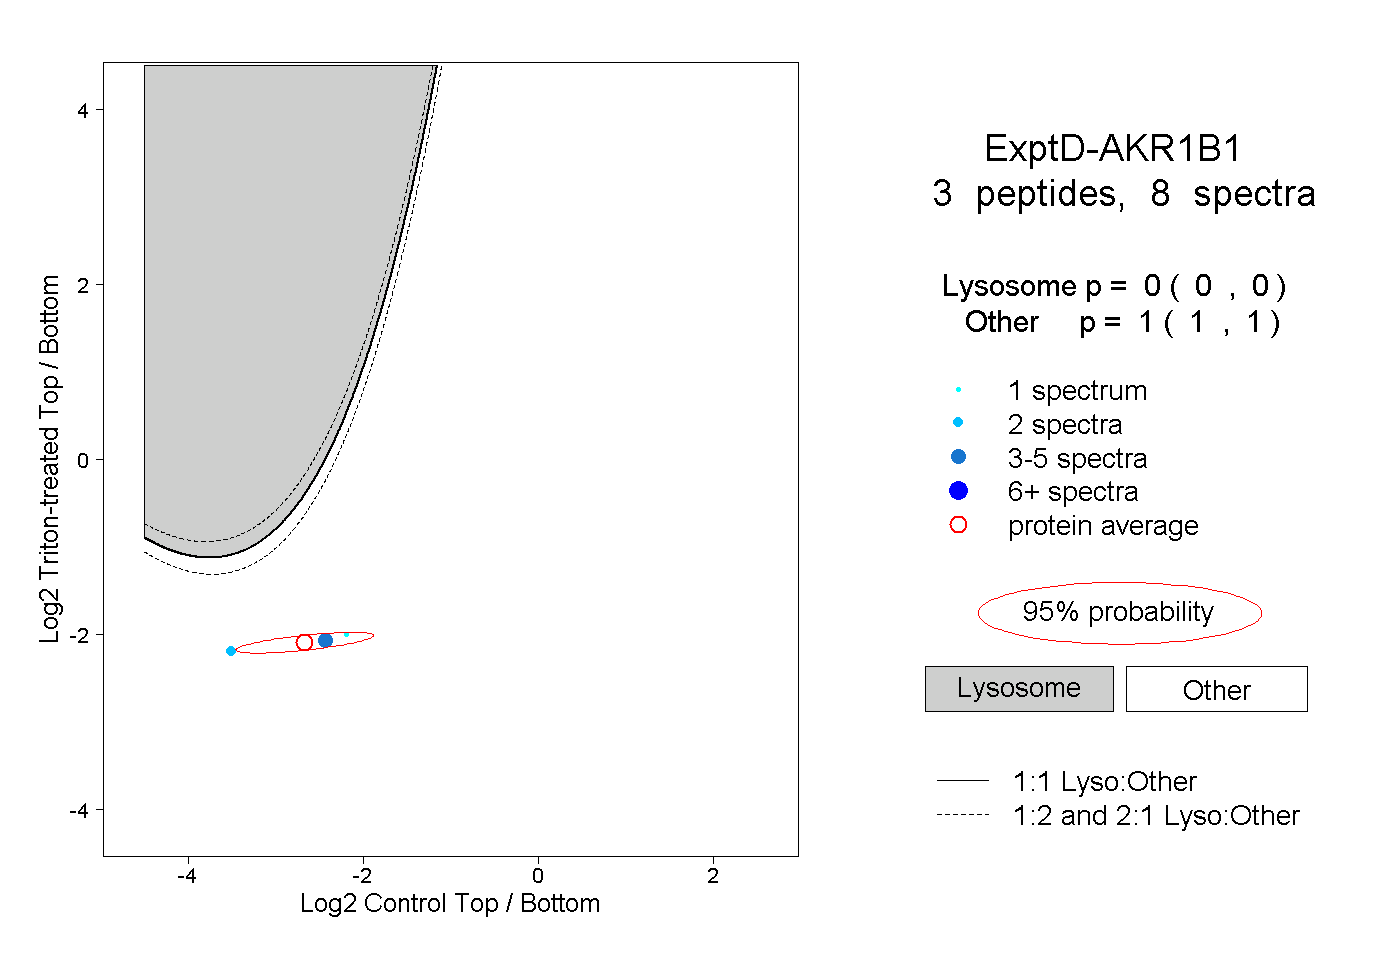
3peptides
spectra
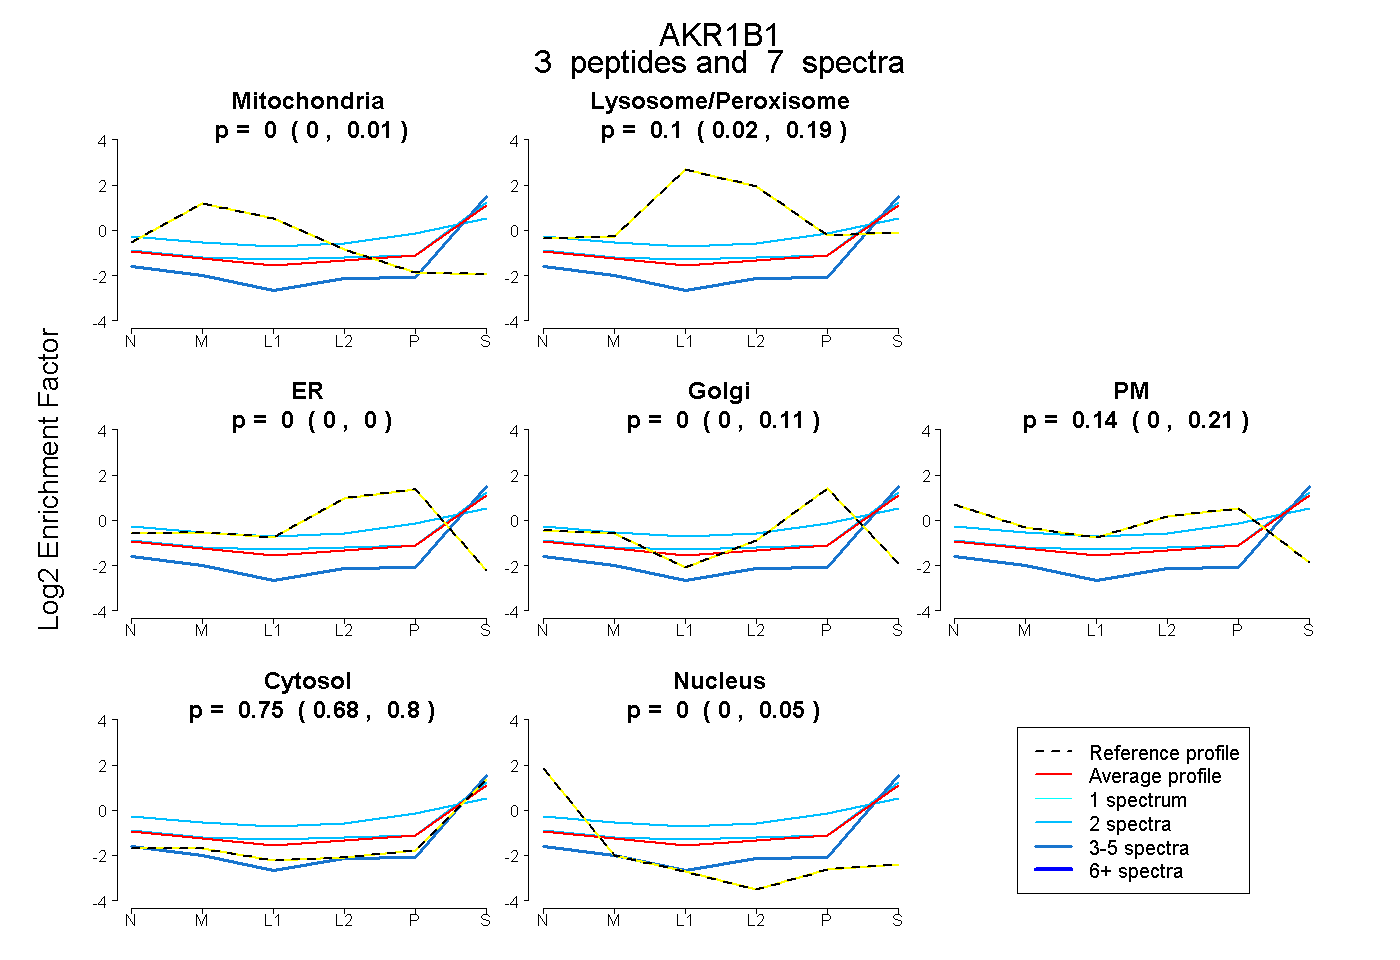
0.000 | 0.009
0.021 | 0.189
0.000 | 0.000
0.000 | 0.113
0.000 | 0.212
0.682 | 0.796
0.000 | 0.051