 11
11peptides
spectra
0.000 | 0.000
0.005 | 0.022
0.000 | 0.000
0.000 | 0.000
0.000 | 0.000
0.000 | 0.000
0.977 | 0.993
0.000 | 0.000
| Plot | Mito | Lyso | Perox | ER | Golgi | PM | Cytosol | Nucleus | |||||
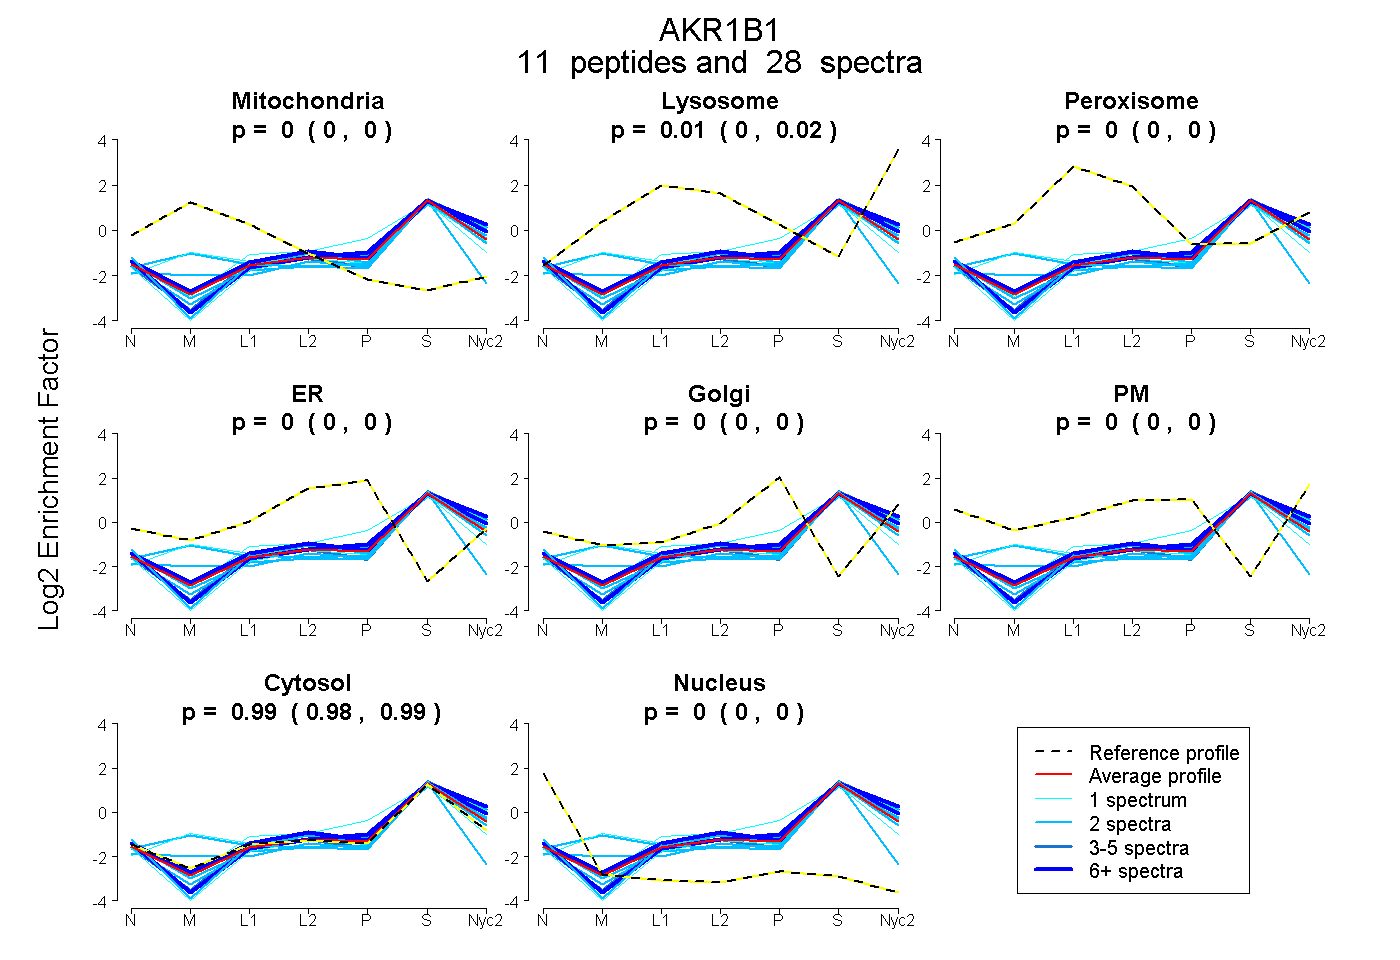
| Expt A |
11 peptides |
28 spectra |
|
0.000 0.000 | 0.000 |
0.014 0.005 | 0.022 |
0.000 0.000 | 0.000 |
0.000 0.000 | 0.000 |
0.000 0.000 | 0.000 |
0.000 0.000 | 0.000 |
0.986 0.977 | 0.993 |
0.000 0.000 | 0.000 |
| 2 spectra, NLVVIPK | 0.000 | 0.026 | 0.000 | 0.000 | 0.000 | 0.000 | 0.974 | 0.000 | ||
| 2 spectra, MPTLGLGTWK | 0.006 | 0.000 | 0.000 | 0.000 | 0.000 | 0.000 | 0.994 | 0.000 | ||
| 6 spectra, SVTAPR | 0.000 | 0.000 | 0.000 | 0.000 | 0.021 | 0.000 | 0.979 | 0.000 | ||
| 2 spectra, VAIDMGYR | 0.000 | 0.000 | 0.000 | 0.000 | 0.000 | 0.000 | 0.997 | 0.003 | ||
| 1 spectrum, HIDCAQVYQNEK | 0.000 | 0.000 | 0.000 | 0.102 | 0.000 | 0.000 | 0.898 | 0.000 | ||
| 2 spectra, LIEYCHCK | 0.000 | 0.000 | 0.000 | 0.000 | 0.000 | 0.000 | 0.867 | 0.133 | ||
| 6 spectra, TTAQVLIR | 0.000 | 0.098 | 0.000 | 0.000 | 0.000 | 0.000 | 0.902 | 0.000 | ||
| 1 spectrum, LWCTFHDQSMVK | 0.081 | 0.104 | 0.000 | 0.000 | 0.000 | 0.000 | 0.816 | 0.000 | ||
| 2 spectra, IAENFK | 0.068 | 0.120 | 0.000 | 0.000 | 0.000 | 0.000 | 0.812 | 0.000 | ||
| 1 spectrum, SPPGQVTEAVK | 0.000 | 0.000 | 0.000 | 0.000 | 0.000 | 0.000 | 1.000 | 0.000 | ||
| 3 spectra, AIGVSNFNPLQIER | 0.000 | 0.016 | 0.000 | 0.000 | 0.000 | 0.000 | 0.984 | 0.000 |
| Plot | Mito | Lyso or Perox | ER | Golgi | PM | Cytosol | Nucleus | ||||||
| Expt B |
3 peptides |
7 spectra |
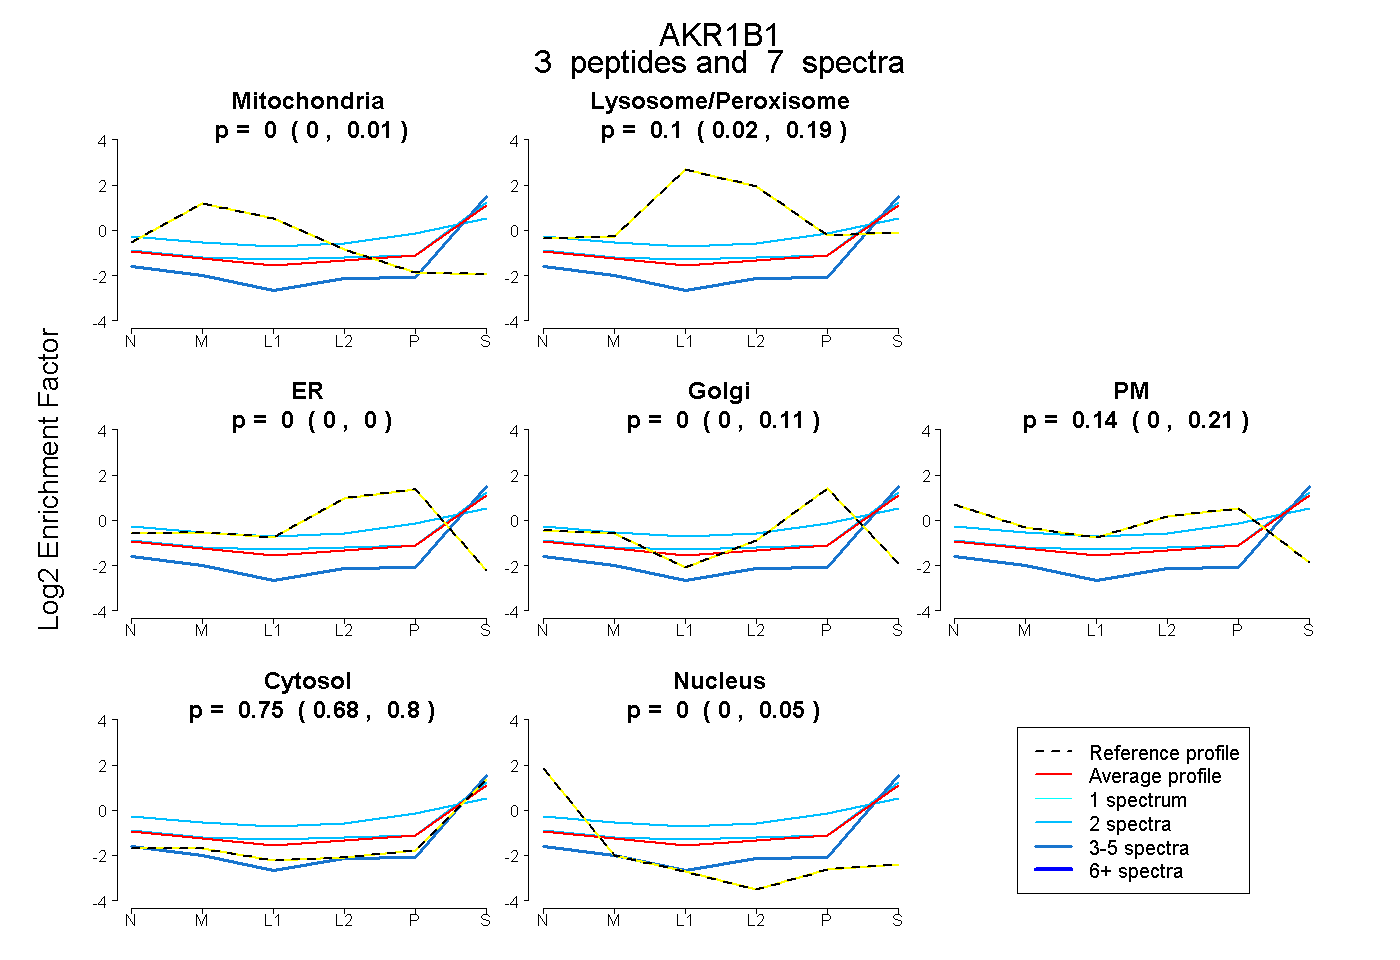 |
0.000 0.000 | 0.009 |
0.104 0.021 | 0.189 |
0.000 0.000 | 0.000 |
0.000 0.000 | 0.113 |
0.145 0.000 | 0.212 |
0.751 0.682 | 0.796 |
0.000 0.000 | 0.051 |
|||
| Plot | Lyso | Other | |||||||||||
| Expt C |
11 peptides |
37 spectra |
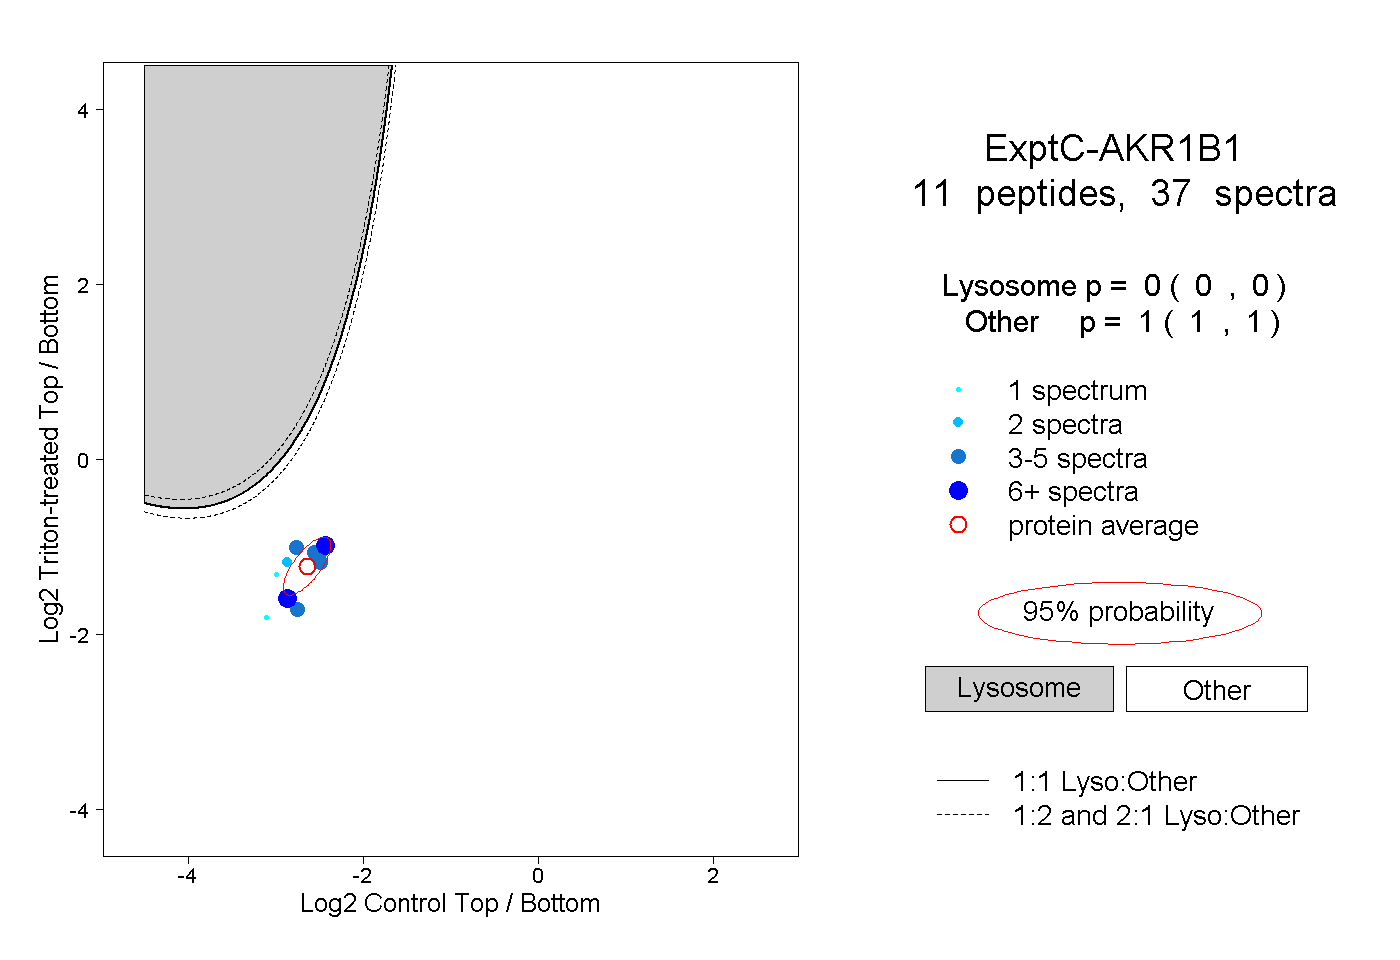 |
0.000 0.000 | 0.000 |
1.000 1.000 | 1.000 |
||||||||
| Plot | Lyso | Other | |||||||||||
| Expt D |
3 peptides |
8 spectra |
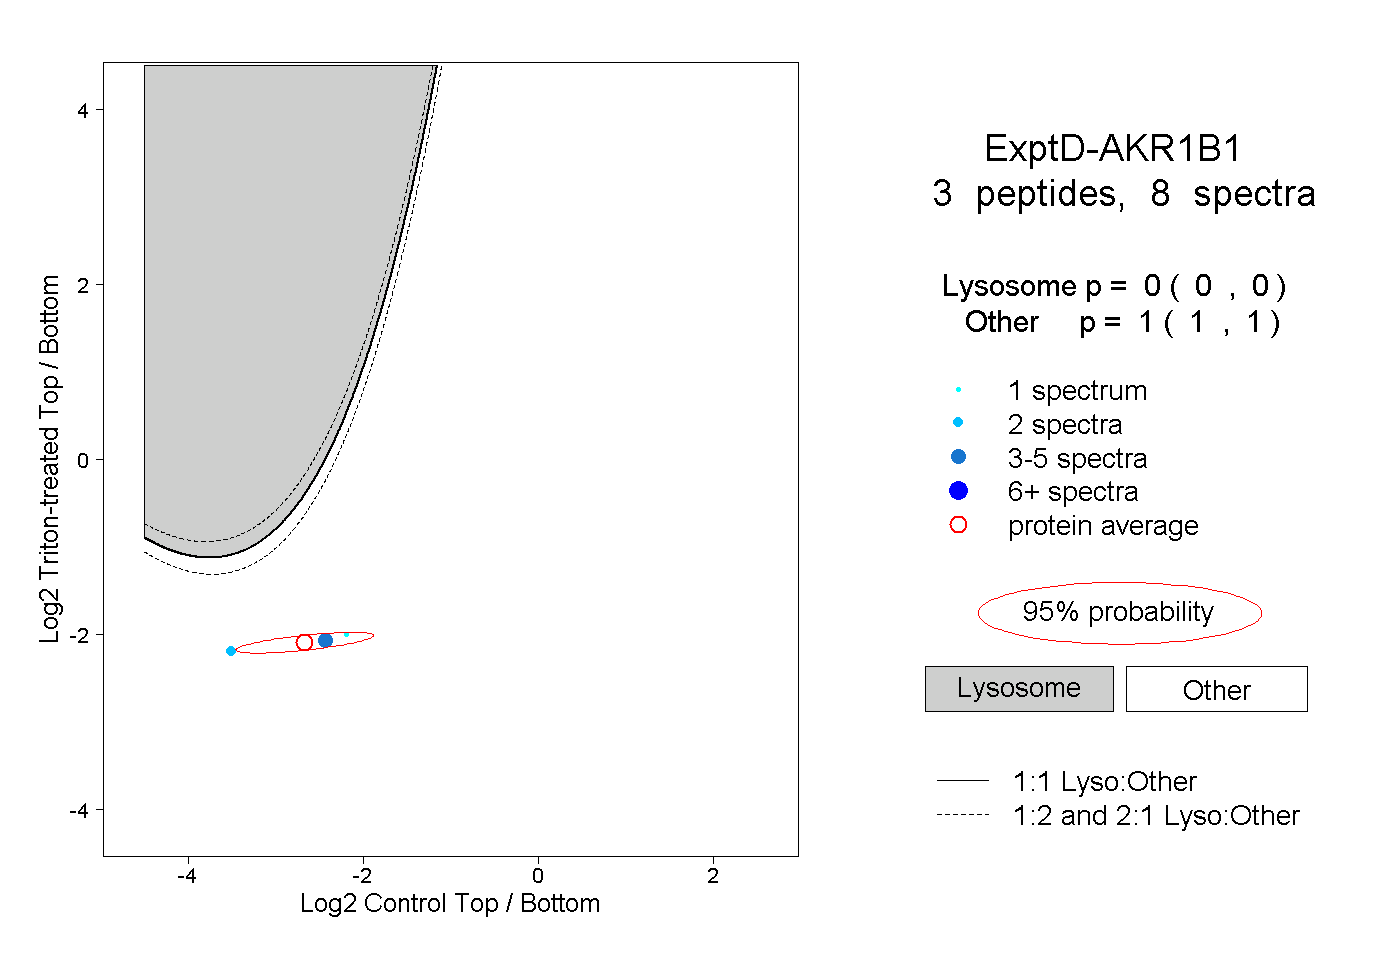 |
0.000 0.000 | 0.000 |
1.000 1.000 | 1.000 |