 12
12peptides
spectra
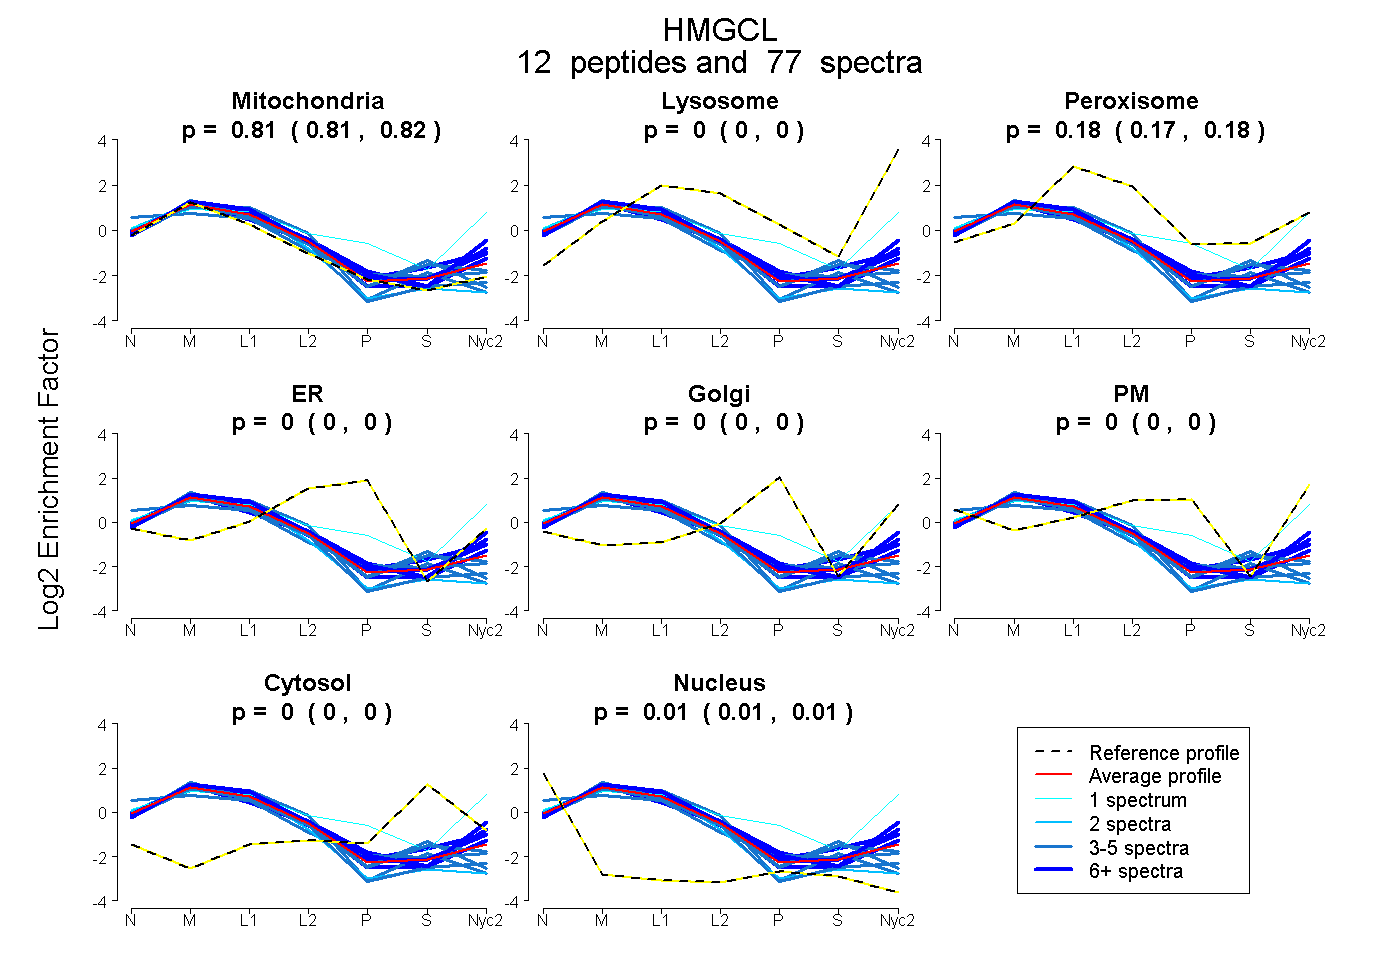
0.807 | 0.819
0.000 | 0.000
0.171 | 0.183
0.000 | 0.000
0.000 | 0.000
0.000 | 0.000
0.000 | 0.000
0.007 | 0.011
10peptides
spectra
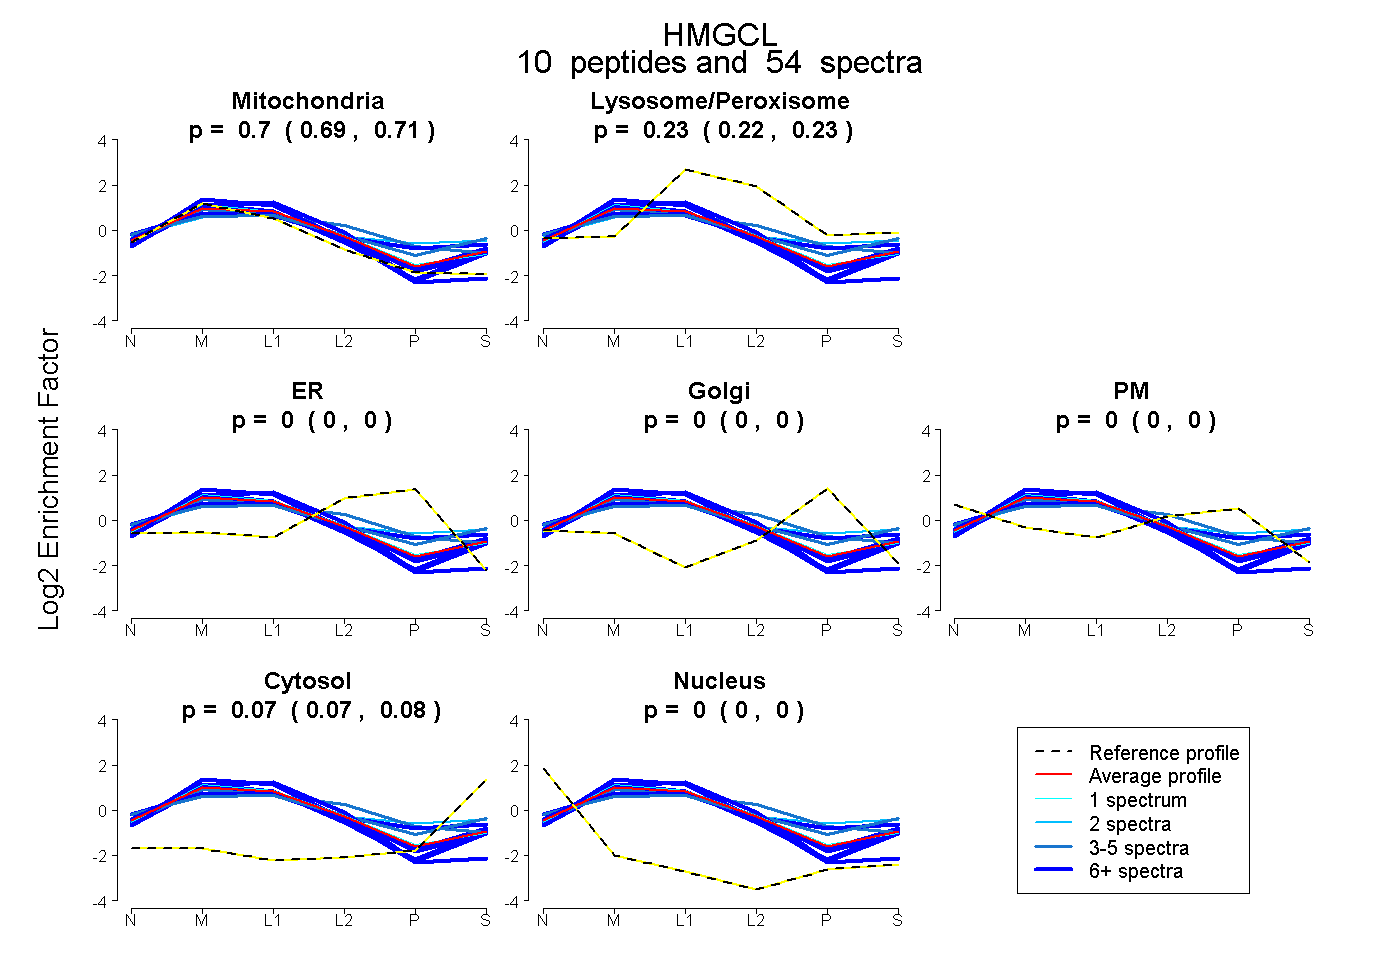
0.689 | 0.707
0.222 | 0.235
0.000 | 0.000
0.000 | 0.000
0.000 | 0.000
0.066 | 0.077
0.000 | 0.000
16peptides
spectra
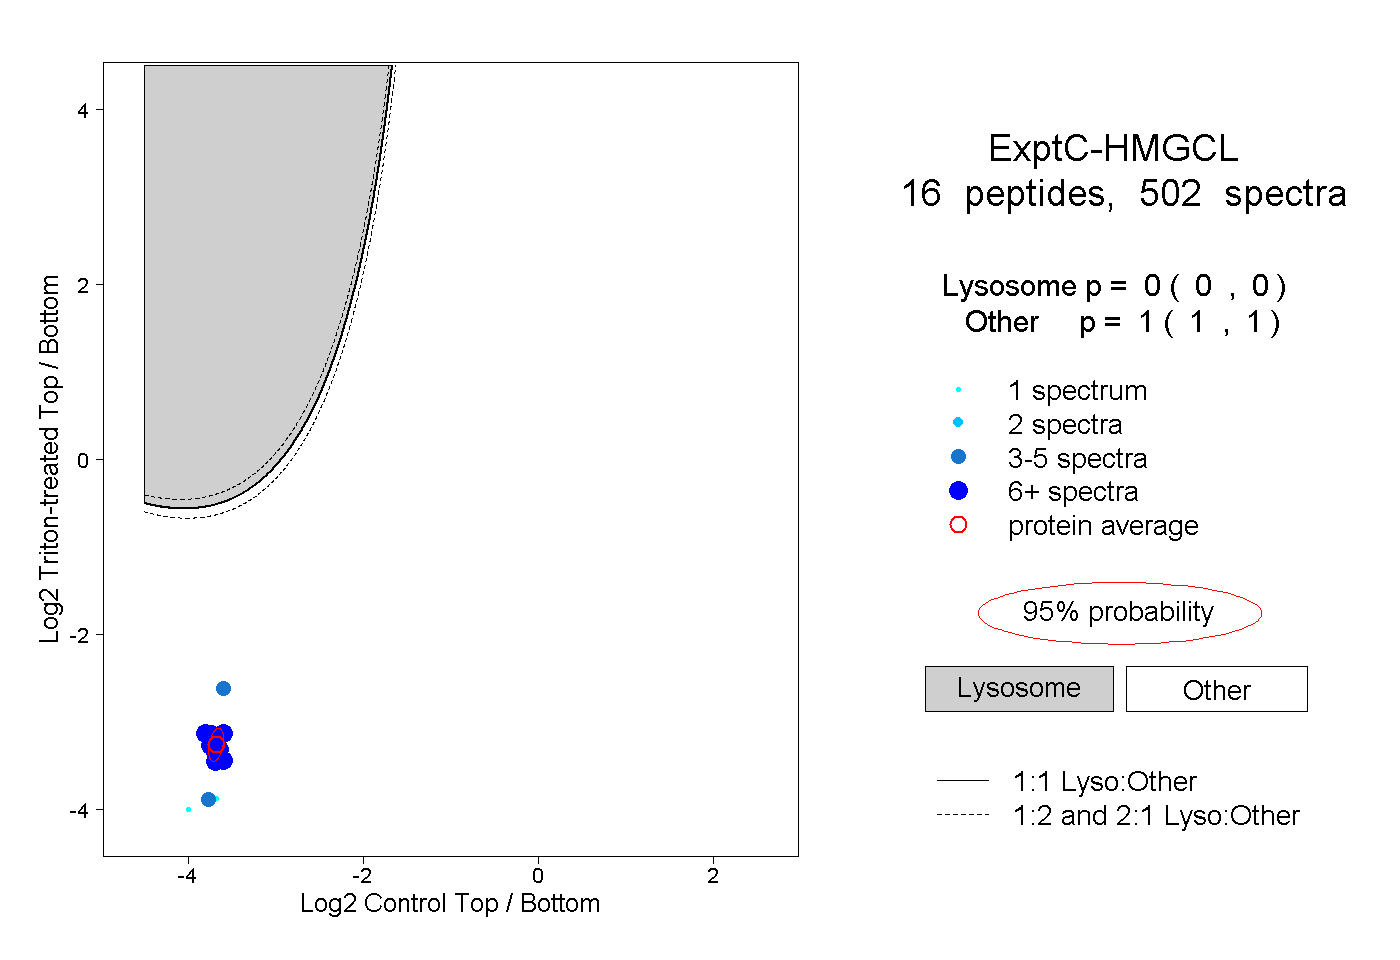
0.000 | 0.000
1.000 | 1.000
9peptides
spectra
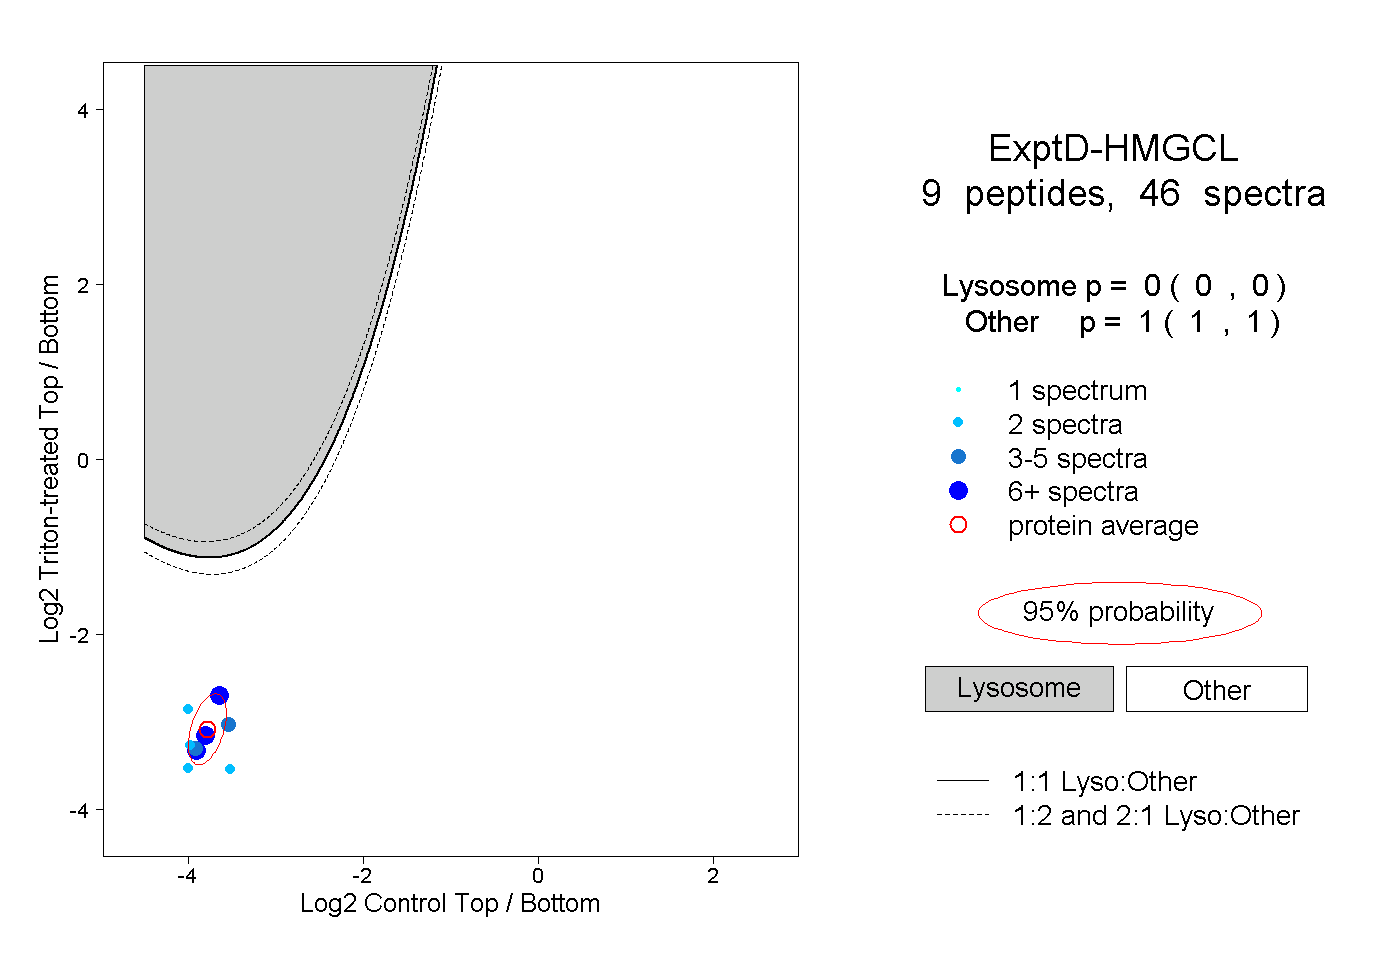
0.000 | 0.000
1.000 | 1.000