 9
9peptides
spectra
0.018 | 0.054
0.000 | 0.000
0.337 | 0.361
0.000 | 0.000
0.128 | 0.164
0.000 | 0.000
0.448 | 0.479
0.000 | 0.000
| Plot | Mito | Lyso | Perox | ER | Golgi | PM | Cytosol | Nucleus | |||||
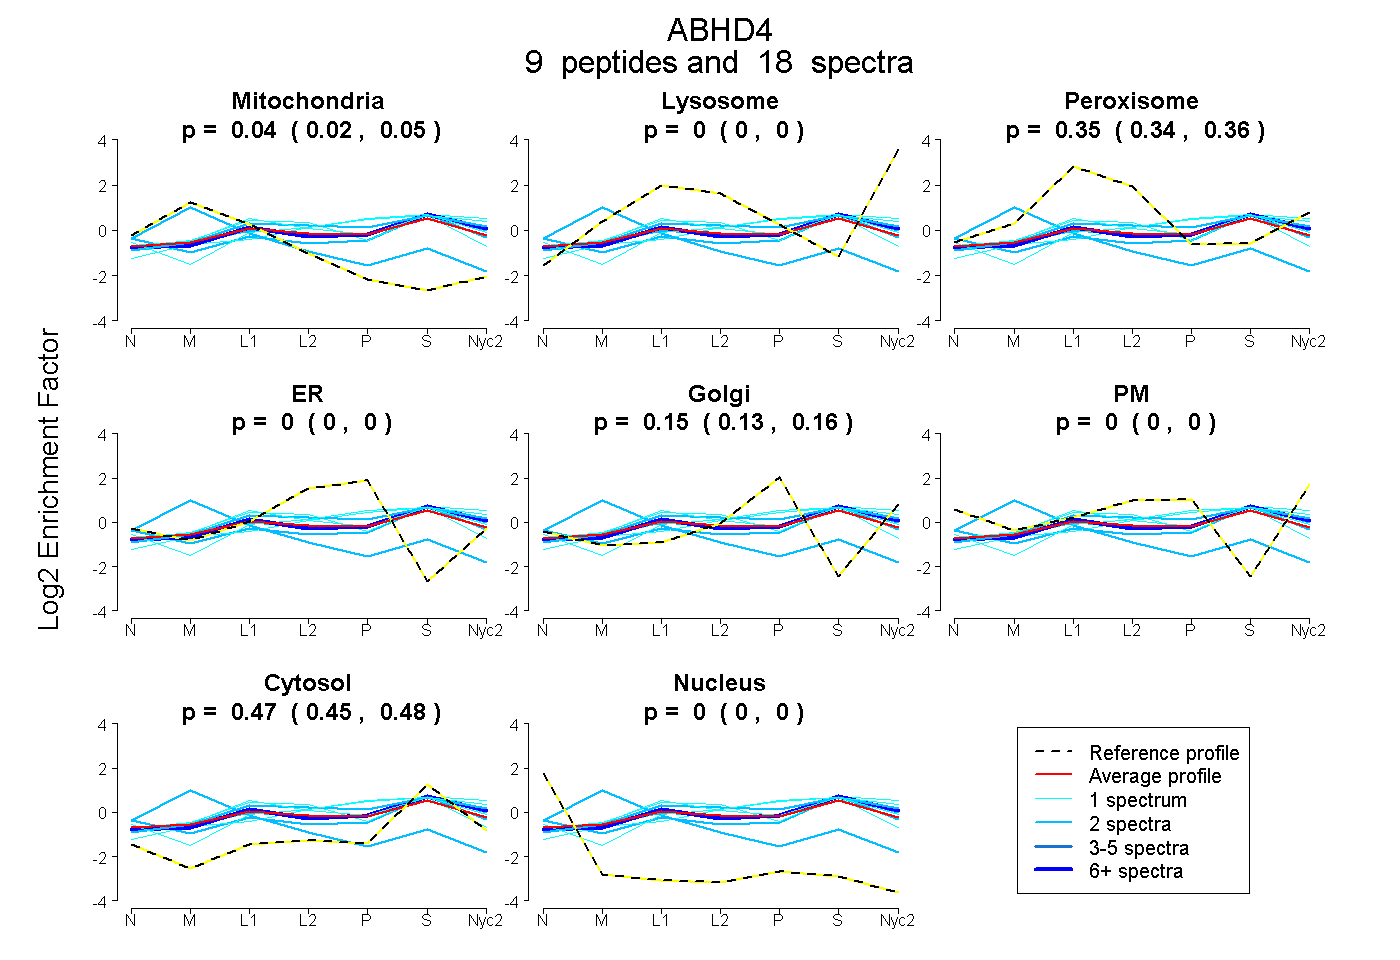
| Expt A |
9 peptides |
18 spectra |
|
0.037 0.018 | 0.054 |
0.000 0.000 | 0.000 |
0.350 0.337 | 0.361 |
0.000 0.000 | 0.000 |
0.147 0.128 | 0.164 |
0.000 0.000 | 0.000 |
0.465 0.448 | 0.479 |
0.000 0.000 | 0.000 |
| 2 spectra, LQRPDSYVR | 0.000 | 0.028 | 0.330 | 0.000 | 0.136 | 0.000 | 0.506 | 0.000 | ||
| 1 spectrum, FRPDFK | 0.000 | 0.138 | 0.367 | 0.000 | 0.000 | 0.046 | 0.450 | 0.000 | ||
| 2 spectra, AMMESFGWAR | 0.046 | 0.000 | 0.201 | 0.000 | 0.004 | 0.152 | 0.597 | 0.000 | ||
| 1 spectrum, DVPITMIYGANTWIDTSTGK | 0.000 | 0.000 | 0.187 | 0.280 | 0.000 | 0.000 | 0.533 | 0.000 | ||
| 6 spectra, TLHTFDLLGFGR | 0.000 | 0.032 | 0.334 | 0.000 | 0.132 | 0.000 | 0.502 | 0.000 | ||
| 1 spectrum, VAGPWGPGLVQR | 0.000 | 0.084 | 0.395 | 0.000 | 0.091 | 0.000 | 0.430 | 0.000 | ||
| 1 spectrum, YVSLPNQNK | 0.000 | 0.000 | 0.234 | 0.122 | 0.155 | 0.000 | 0.489 | 0.000 | ||
| 2 spectra, SSRPTFPR | 0.681 | 0.000 | 0.069 | 0.000 | 0.000 | 0.000 | 0.251 | 0.000 | ||
| 2 spectra, TPPTWVK | 0.000 | 0.052 | 0.380 | 0.000 | 0.143 | 0.000 | 0.425 | 0.000 |
| Plot | Mito | Lyso or Perox | ER | Golgi | PM | Cytosol | Nucleus | ||||||
| Expt B |
4 peptides |
6 spectra |
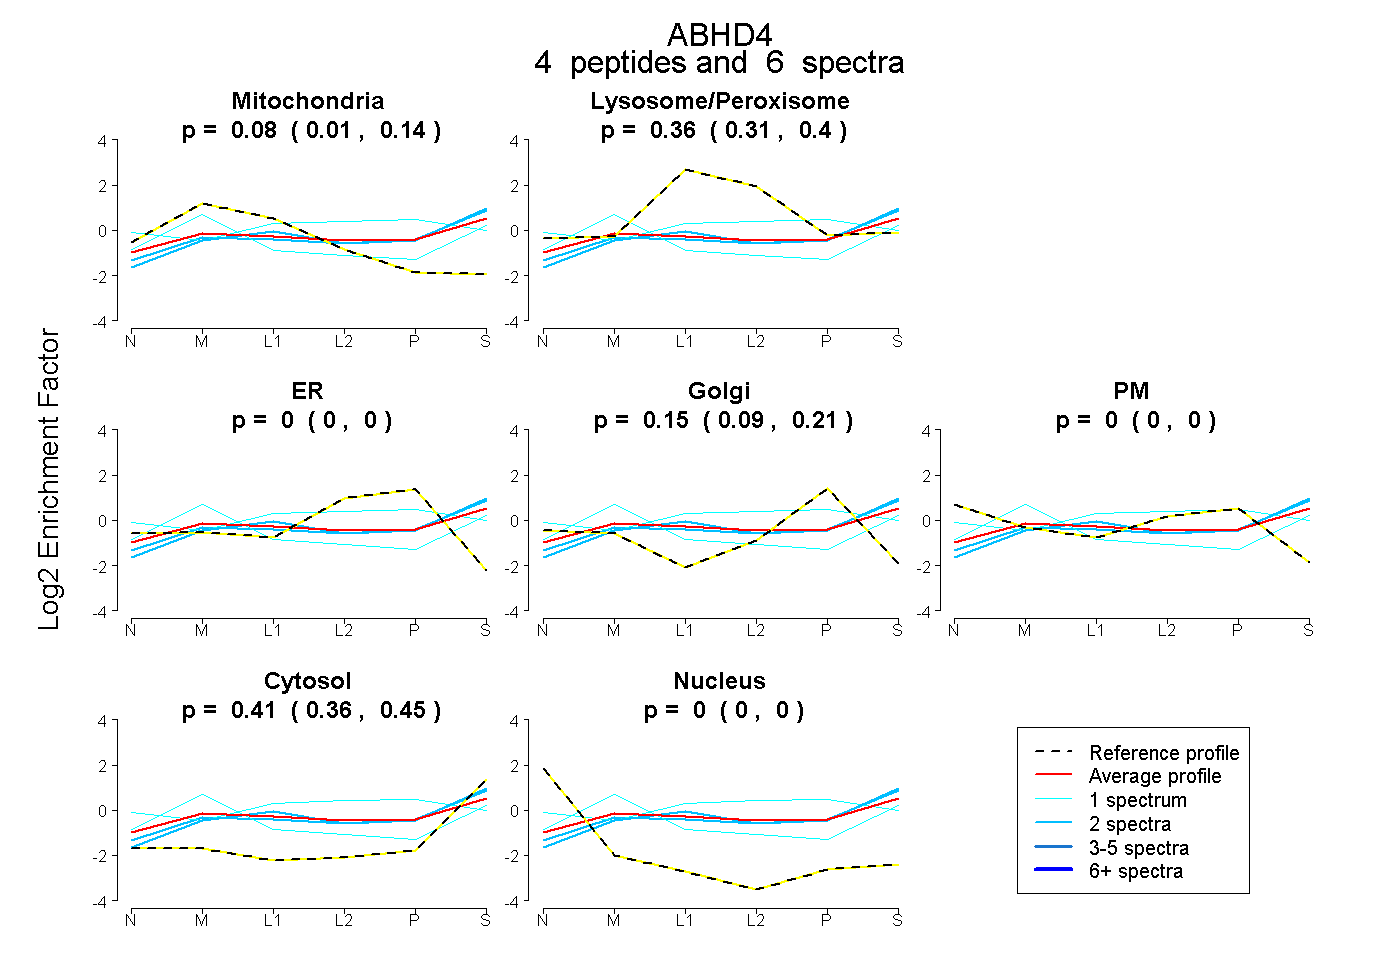 |
0.080 0.009 | 0.144 |
0.358 0.305 | 0.400 |
0.000 0.000 | 0.000 |
0.154 0.085 | 0.210 |
0.000 0.000 | 0.000 |
0.407 0.357 | 0.447 |
0.000 0.000 | 0.000 |
|||
| Plot | Lyso | Other | |||||||||||
| Expt C |
10 peptides |
42 spectra |
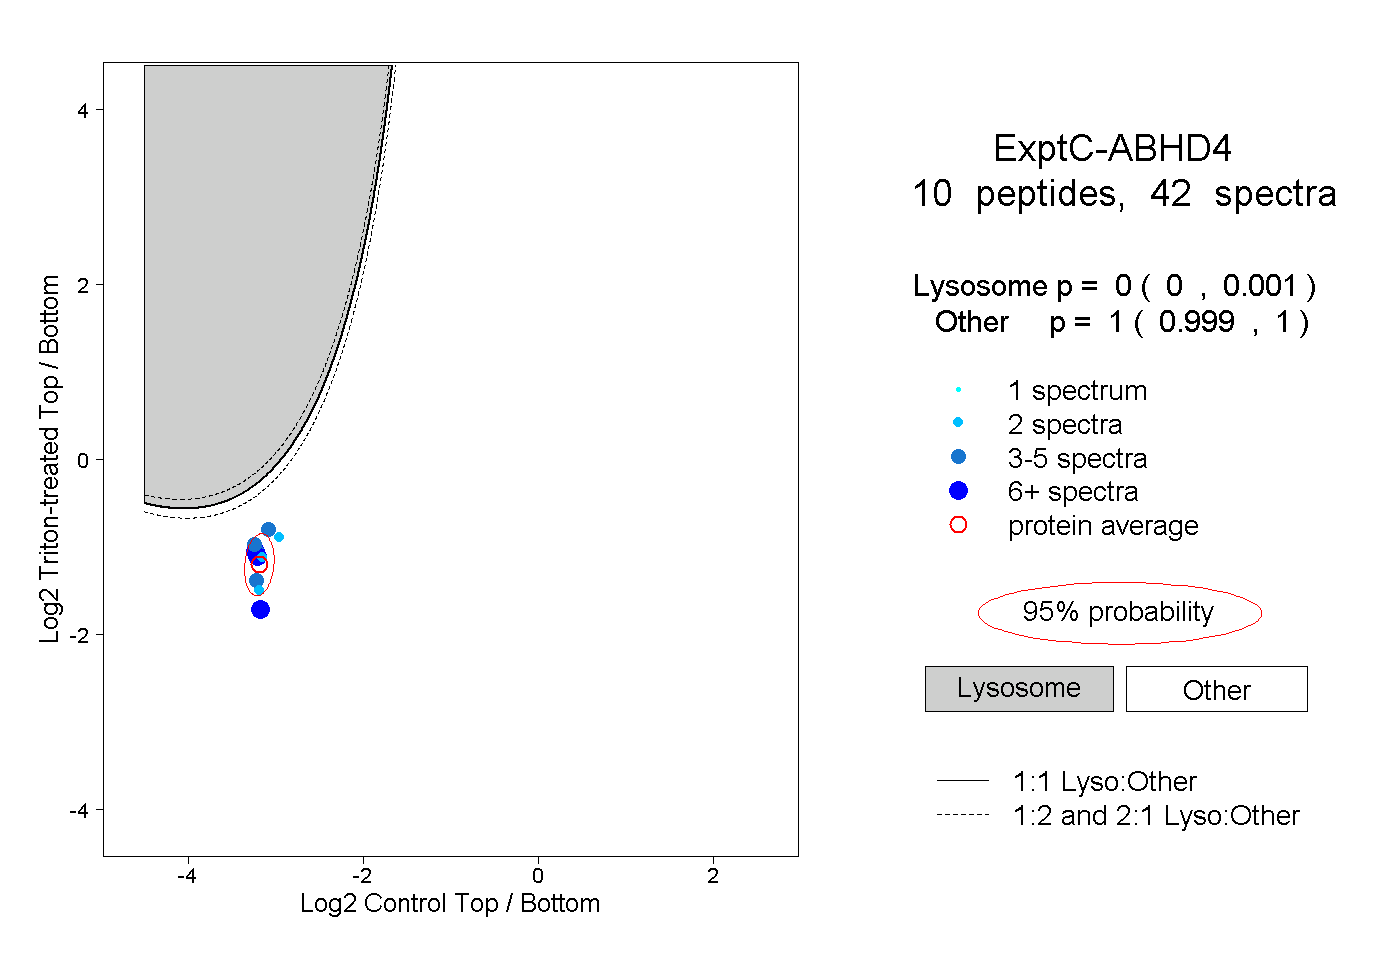 |
0.000 0.000 | 0.001 |
1.000 0.999 | 1.000 |
||||||||
| Plot | Lyso | Other | |||||||||||
| Expt D |
3 peptides |
6 spectra |
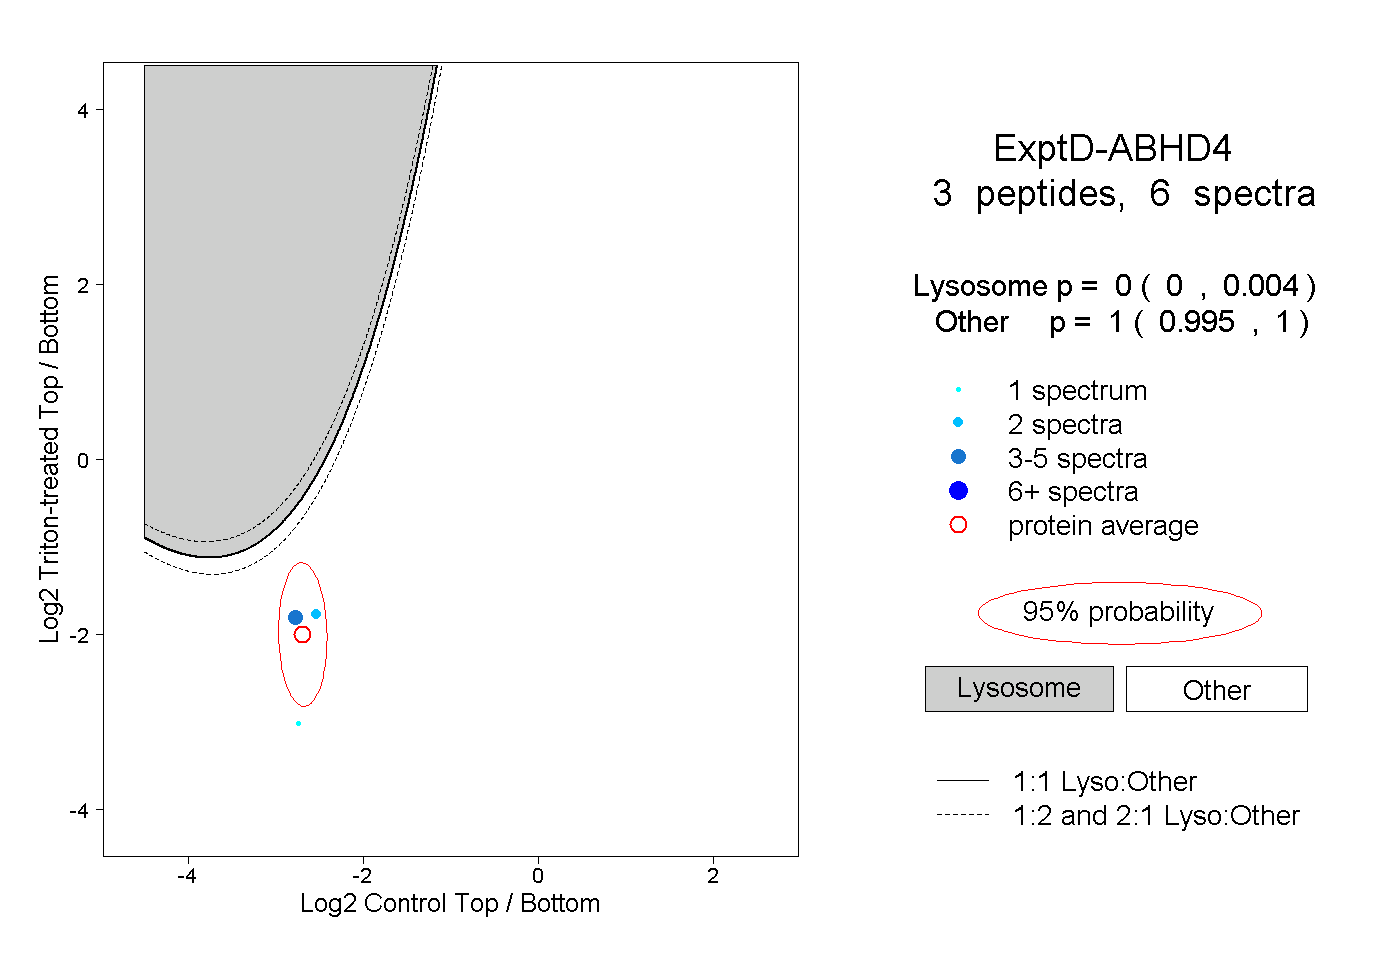 |
0.000 0.000 | 0.004 |
1.000 0.995 | 1.000 |