 4
4peptides
spectra
0.000 | 0.000
0.000 | 0.000
0.000 | 0.000
0.651 | 0.869
0.000 | 0.197
0.000 | 0.000
0.000 | 0.000
0.107 | 0.151
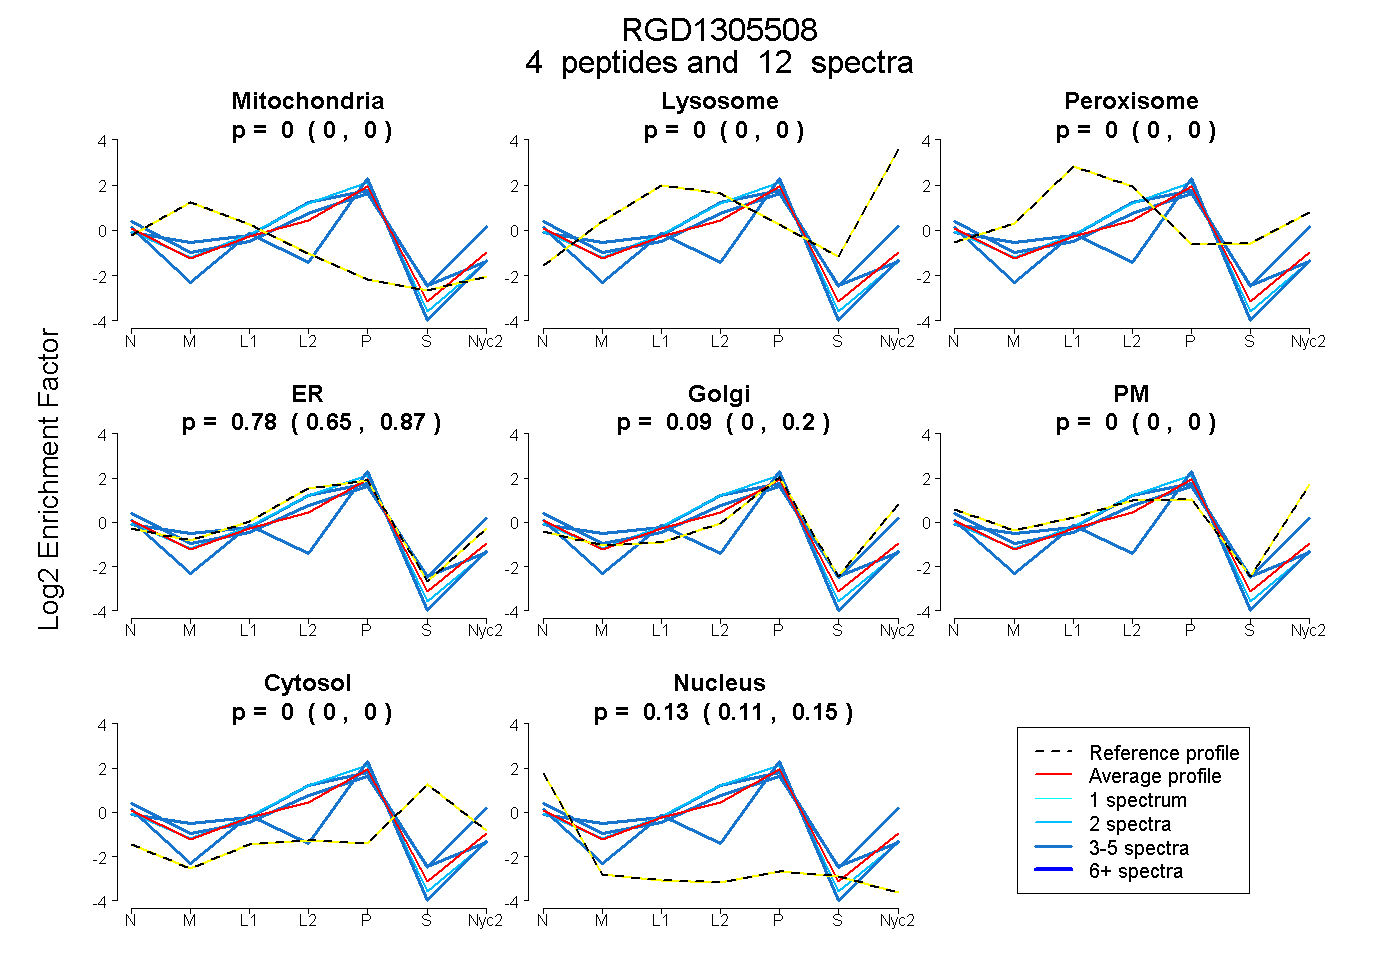
| Plot | Mito | Lyso | Perox | ER | Golgi | PM | Cytosol | Nucleus | |||||
| Expt A |
4 peptides |
12 spectra |
|
0.000 0.000 | 0.000 |
0.000 0.000 | 0.000 |
0.000 0.000 | 0.000 |
0.778 0.651 | 0.869 |
0.090 0.000 | 0.197 |
0.000 0.000 | 0.000 |
0.000 0.000 | 0.000 |
0.131 0.107 | 0.151 |
| 4 spectra, TTISGPSR | 0.000 | 0.000 | 0.000 | 0.276 | 0.485 | 0.000 | 0.000 | 0.239 | ||
| 3 spectra, YFANCHVEEVSAAAR | 0.000 | 0.000 | 0.000 | 0.834 | 0.000 | 0.000 | 0.000 | 0.166 | ||
| 3 spectra, LANVLFAR | 0.017 | 0.000 | 0.000 | 0.658 | 0.153 | 0.173 | 0.000 | 0.000 | ||
| 2 spectra, LDCPVVGWQQELR | 0.000 | 0.000 | 0.000 | 0.908 | 0.000 | 0.000 | 0.000 | 0.092 |
| Plot | Mito | Lyso or Perox | ER | Golgi | PM | Cytosol | Nucleus | ||||||
| Expt B |
2 peptides |
3 spectra |
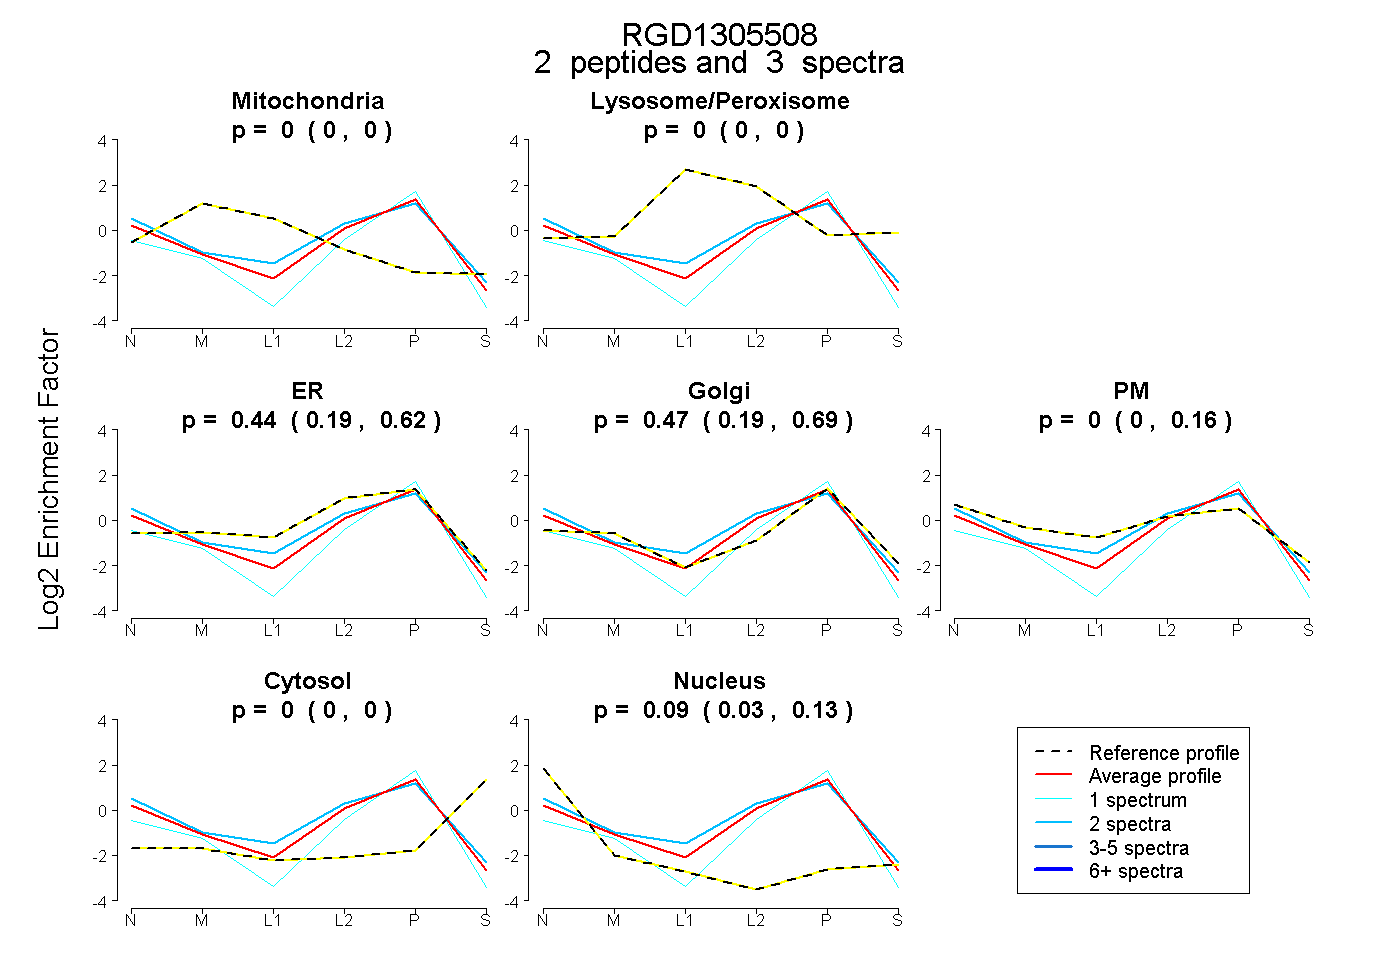 |
0.000 0.000 | 0.000 |
0.000 0.000 | 0.000 |
0.441 0.189 | 0.622 |
0.470 0.193 | 0.687 |
0.000 0.000 | 0.160 |
0.000 0.000 | 0.000 |
0.089 0.028 | 0.134 |
|||
| Plot | Lyso | Other | |||||||||||
| Expt C |
3 peptides |
7 spectra |
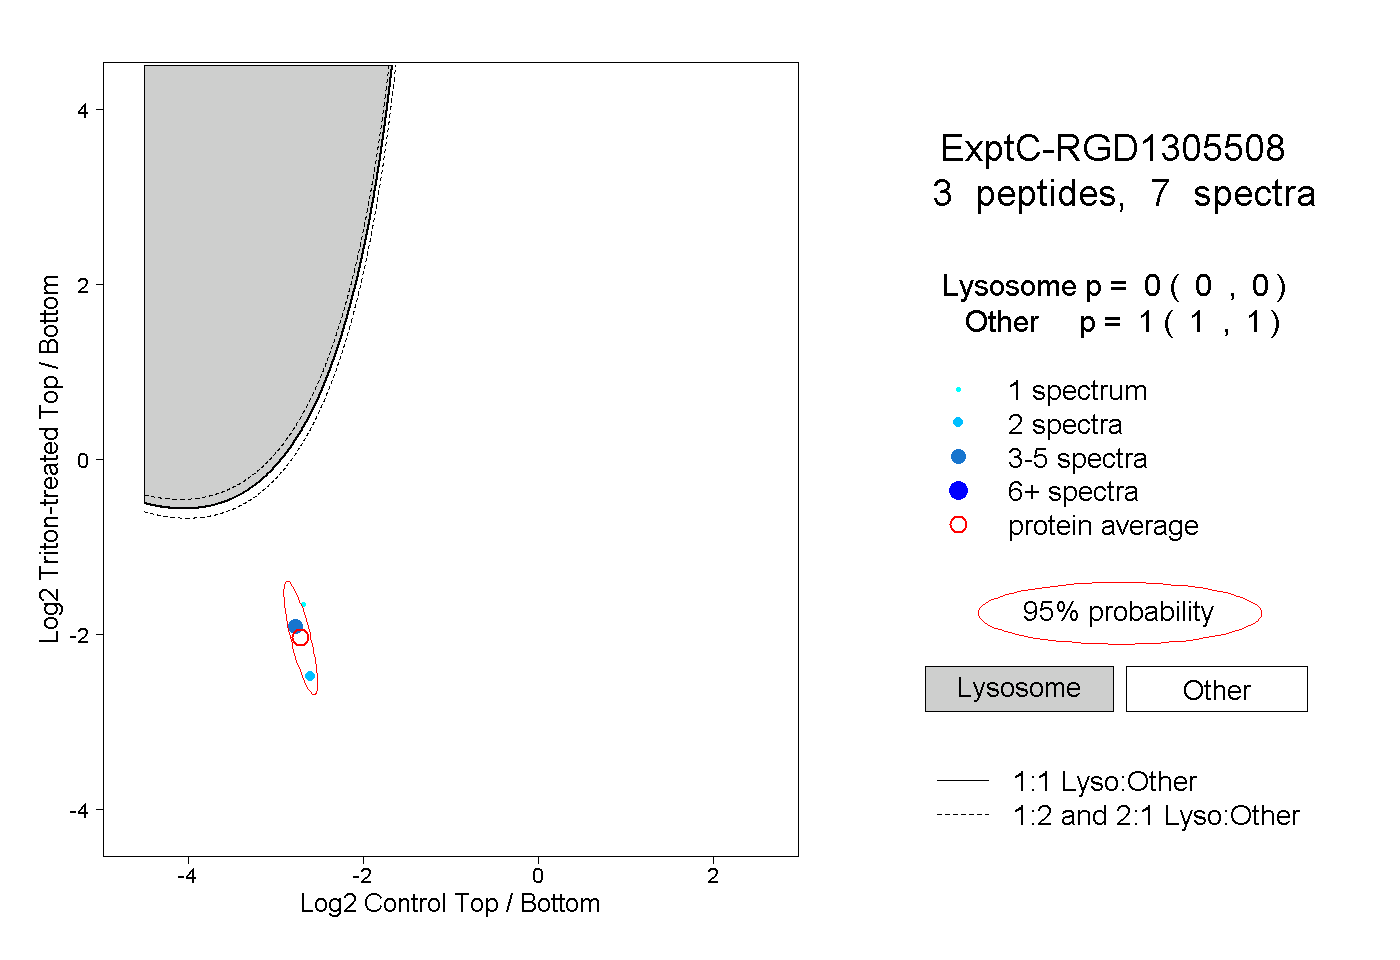 |
0.000 0.000 | 0.000 |
1.000 1.000 | 1.000 |