 2
2peptides
spectra
0.000 | 0.000
0.137 | 0.264
0.000 | 0.171
0.142 | 0.428
0.056 | 0.375
0.033 | 0.355
0.000 | 0.007
0.000 | 0.000
4peptides
spectra
0.000 | 0.000
1.000 | 1.000
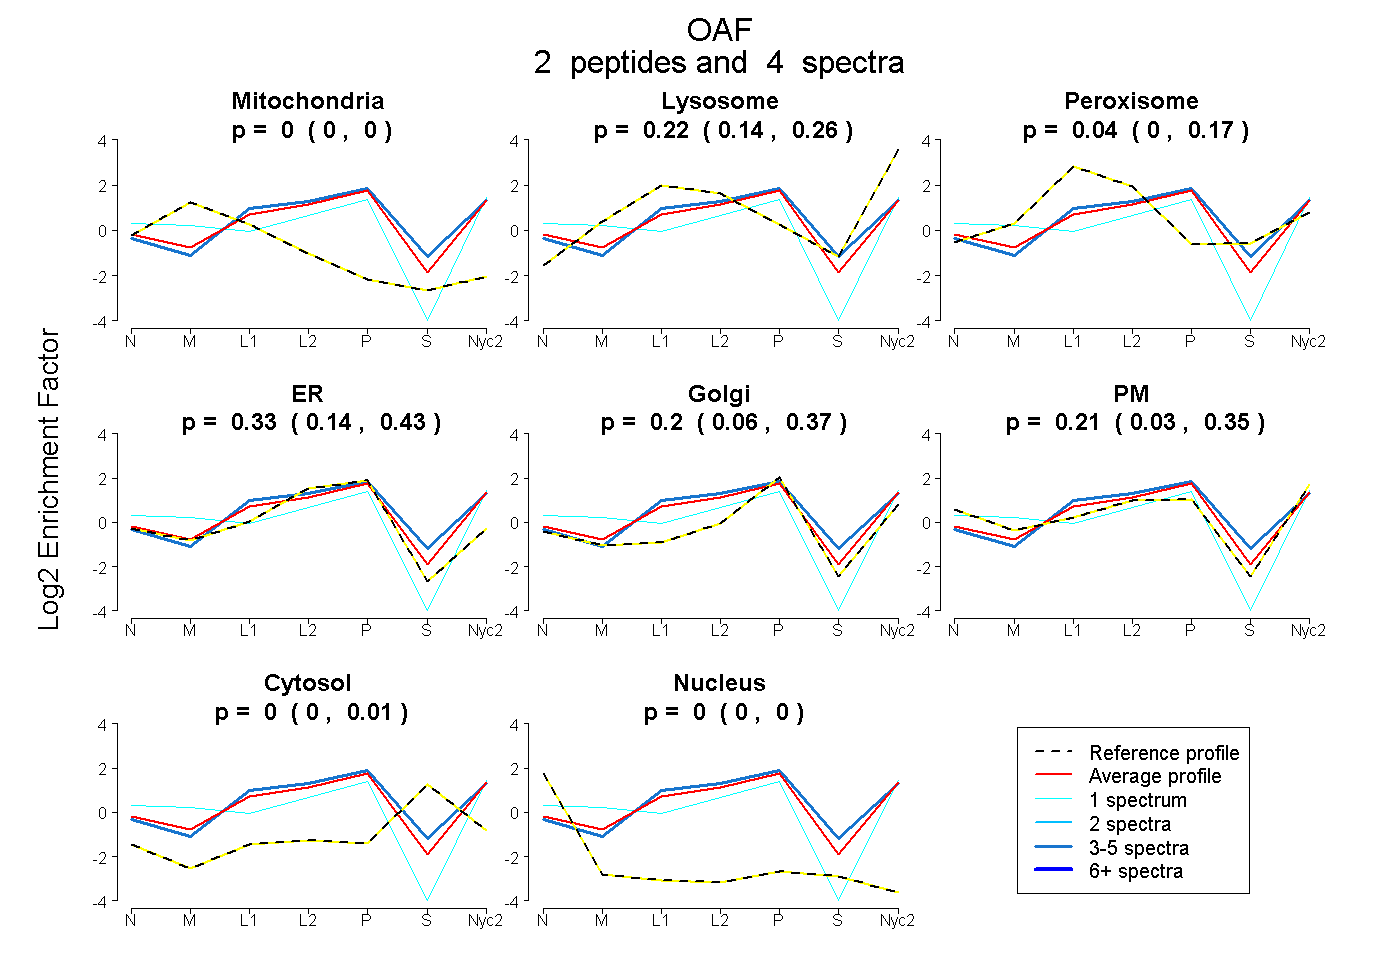
| Plot | Mito | Lyso | Perox | ER | Golgi | PM | Cytosol | Nucleus | |||||
| Expt A |
2 peptides |
4 spectra |
|
0.000 0.000 | 0.000 |
0.219 0.137 | 0.264 |
0.038 0.000 | 0.171 |
0.333 0.142 | 0.428 |
0.203 0.056 | 0.375 |
0.208 0.033 | 0.355 |
0.000 0.000 | 0.007 |
0.000 0.000 | 0.000 |
||
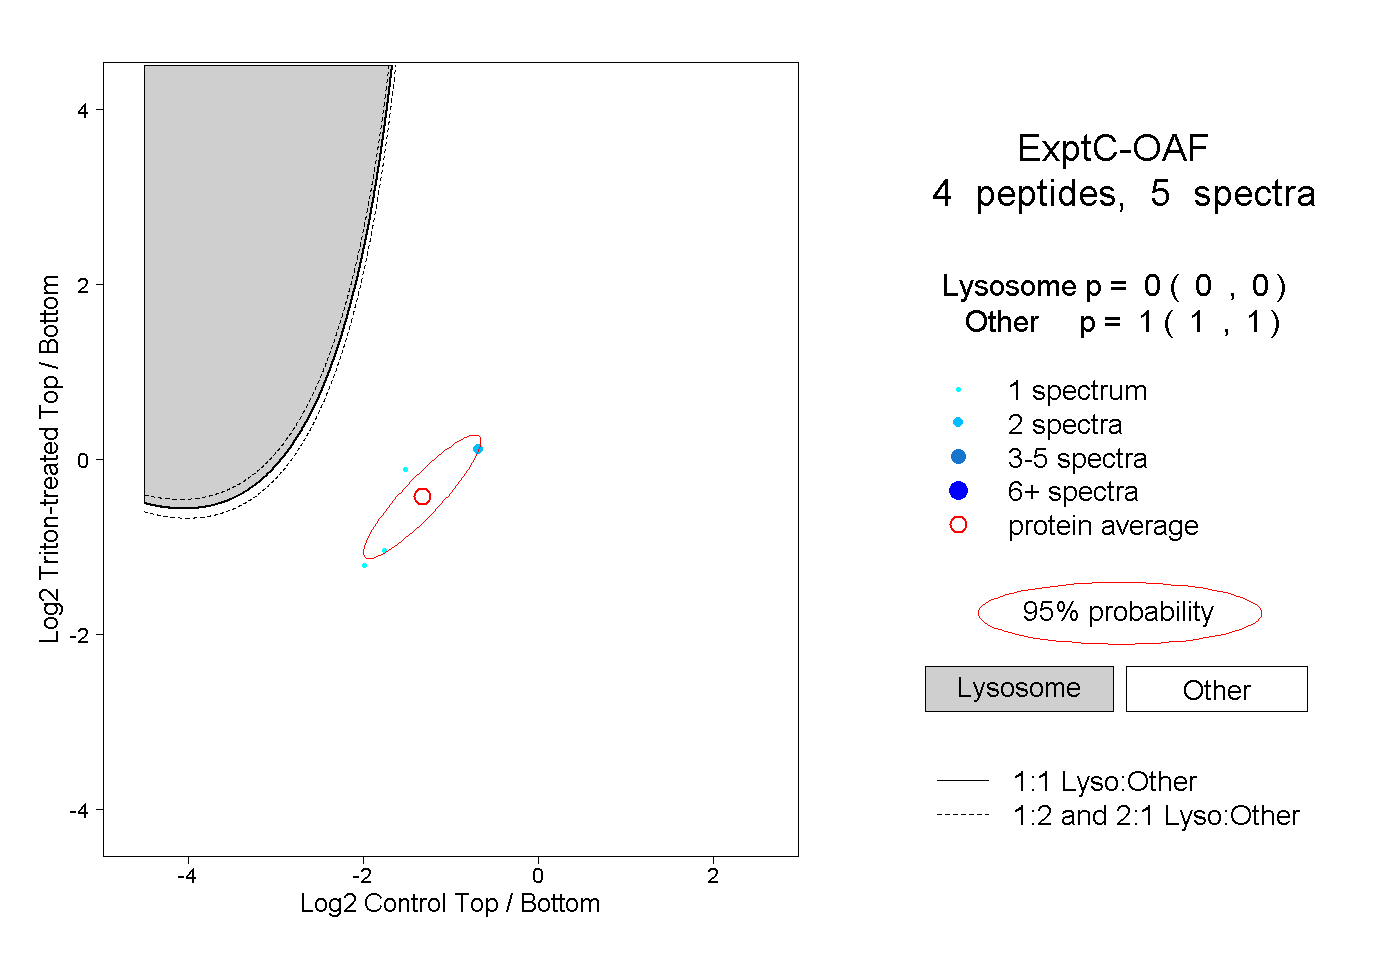
| Plot | Lyso | Other | |||||||||||
| Expt C |
4 peptides |
5 spectra |
|
0.000 0.000 | 0.000 |
1.000 1.000 | 1.000 |